Hierarchy charts are a beneficial tool when it comes to organizing and presenting information in a clear and well-structured way. They are frequently utilized in organizations that are involved in industry and market, government, and academic course to highlight the connections that exist between the various department plans, units, or persons that make up the organization
10+ Hierarchy Chart Samples
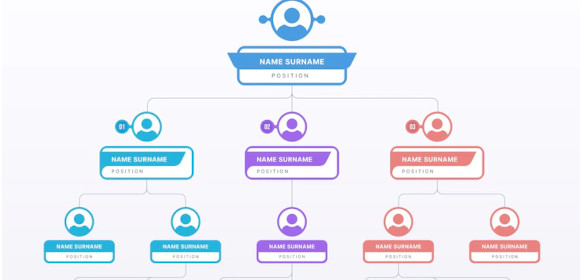
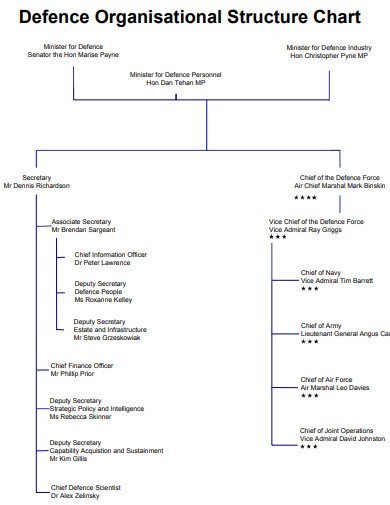
1. Organizational Hierarchy Chart
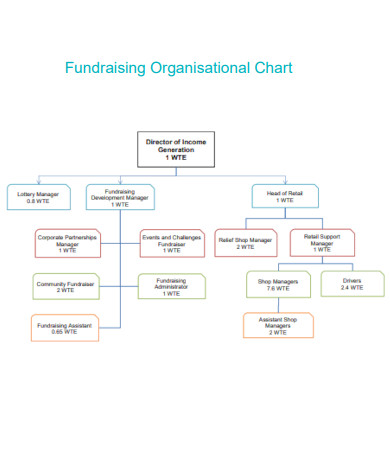
2. Business Hierarchy
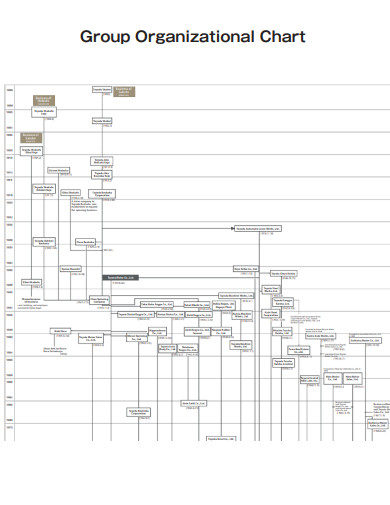
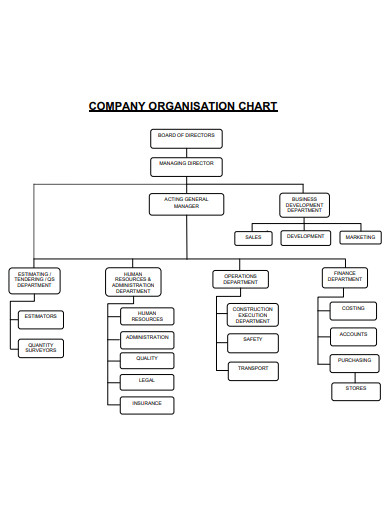
3. Company Hierarchy
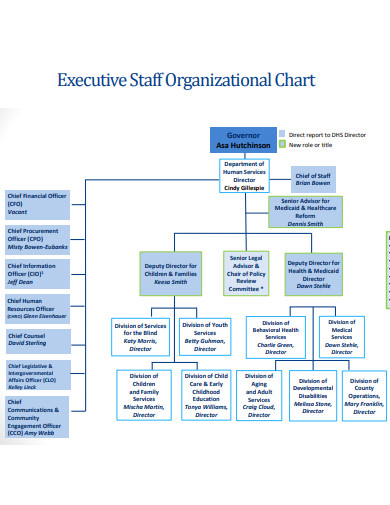
4. Staff Hierarchy
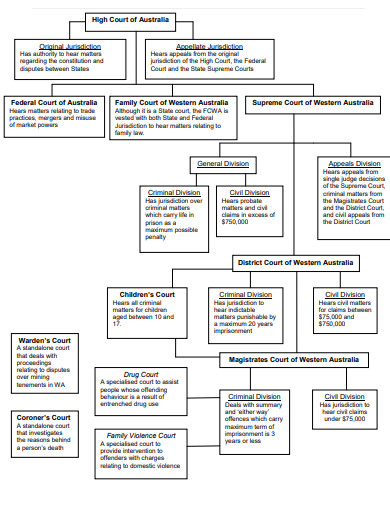
5. Legal Hierarchy Flowchart
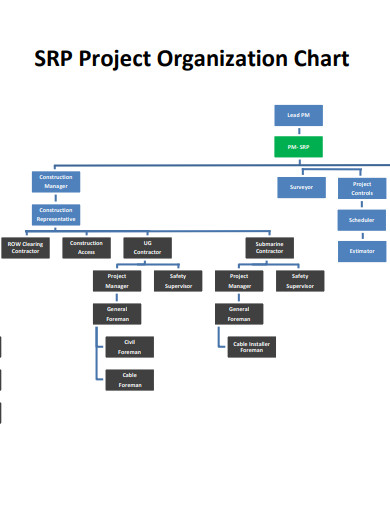
6. Project Hierarchy
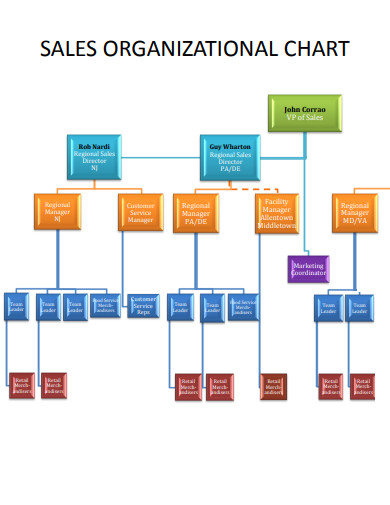
7. Sales Organization Hierarchy
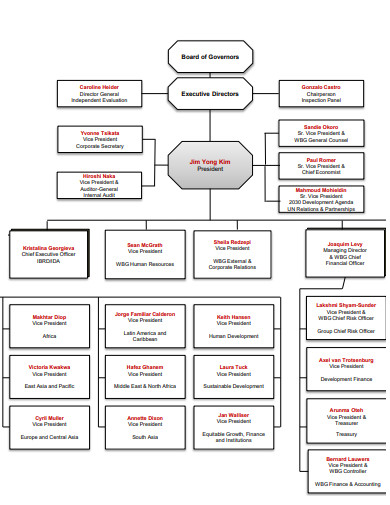
8. Hierarchy Structure Chart
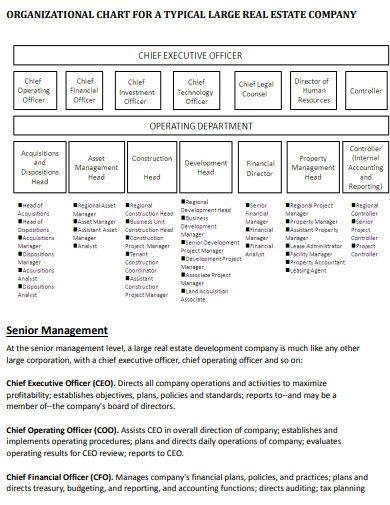
9. Real Estate Company Hierarchy
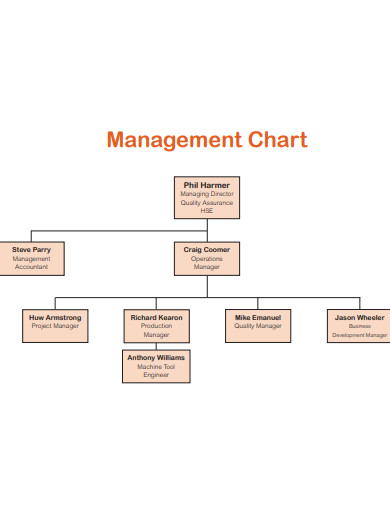
10. Management Chart
11. Simple Hierarchy Chart
What Is Hierarchy Chart?
A hierarchy chart is a visual representation of a system of hierarchy, showing the relationships and relative ranks of the different components within the system. It is a way of organizing and presenting information in a clear and structured manner, with the most important or highest-level elements at the top, and the lesser or lower-level elements below. Hierarchy charts can be used in a variety of settings, including business, government, and academic organizations, to illustrate the relationships between different departments, units, or individuals within the organization. They can also often created using graphics design software or drawing tools, and can be presented in a variety of formats, including flowcharts, org charts, and tree diagrams.
How To Make a Hierarchy Chart?
Hierarchy charts are a useful tool for organizing and presenting information in a clear and structured manner. They are often used in business, government, and academic organizations to illustrate the relationships. To make a hierarchy chart, follow these steps:
Step 1- State Your Purpose
Determine the purpose of the hierarchy chart. What do you want to illustrate or communicate with the chart? Understanding the purpose will help you decide what information to include and how to organize it.
Step 2- Gather Information
Collect all the data and information you will need to create the hierarchy chart. This may include information about the different elements in the hierarchy, their relationships, and their relative importance.
Step3- Organize Information
Determine the structure of the hierarchy chart by arranging the elements in a logical order. The most important or highest-level elements should be placed at the top, with the lesser or lower-level elements below.
Step 4- Choose a Format
There are several different formats that can be used for hierarchy charts, including flowcharts, org charts, and tree diagrams. Select the format that best suits your needs and the information you want to convey.
What are some common formats for hierarchy charts?
Some common formats for hierarchy charts include flowcharts, org charts, and tree diagrams. Flowcharts show the steps in a process, org charts show the relationships between different departments or units within an organization, and tree diagrams show the relationships between different concepts or ideas.
How can a hierarchy chart be used?
A hierarchy chart can be used in a variety of settings, including business, government, and academic organizations, to illustrate the relationships between different departments, units, or individuals within the organization
How is a hierarchy chart created?
To create a hierarchy chart, gather the necessary information, organize the elements in a logical order, choose a format for the chart (such as a flowchart or org chart), and use graphics software or drawing tools to create the chart.
A hierarchy chart is used to illustrate the relationships and relative ranks of different components within a system. It is a way of organizing and presenting information in a clear and structured manner, with the most important or highest-level elements at the top, and the lesser or lower-level elements below.
Related Posts
FREE 8+ Blood Type Chart Samples in PDF | DOC
FREE 10+ Medicine Chart Samples in PDF | MS Word
FREE 10+ Seat Chart Samples in PDF
FREE 10+ Pie Chart Samples in PDF
Free 3+ Eye Color Chart Samples in PDF
FREE 10+ Family Chore Chart Samples in PDF
FREE 10+ Classroom Chart Samples in PDF
FREE 10+ Genealogy Chart Samples in PDF
FREE 10+ Shipping Chart Samples in PDF
FREE 10+ Goal Chart Samples in PDF
FREE 10+ Character Chart Samples in PDF
FREE 10+ Table Seating Chart Samples in PDF
FREE 10+ Classroom Seating Chart Samples in PDF
FREE 10+ Grade Chart Samples in PDF
FREE 10+ Workflow Chart Samples in PDF
