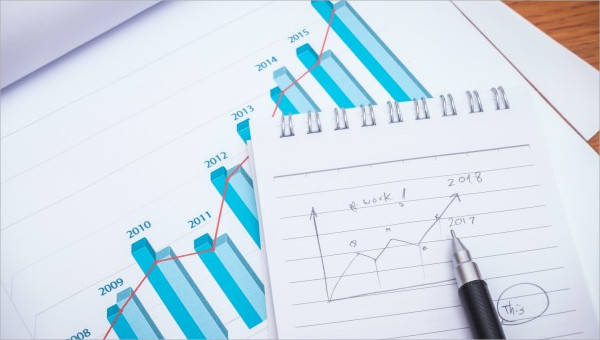
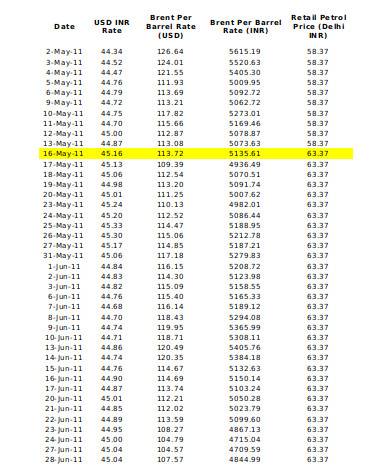
Organizing a chart requires knowledge about charts and charting. There are different kinds of charts created for different purposes. To be able to make an effective and presentable chart, you should select the appropriate type of chart for the data you have available. You just have to know what chart is for what.
You should also have knowledge about the types of charts and their uses. It will help you determine which chart is appropriate for your presentation. And for your price chart needs, you can check out these samples that are available online for download. It’s a convenient way to sort your prices.
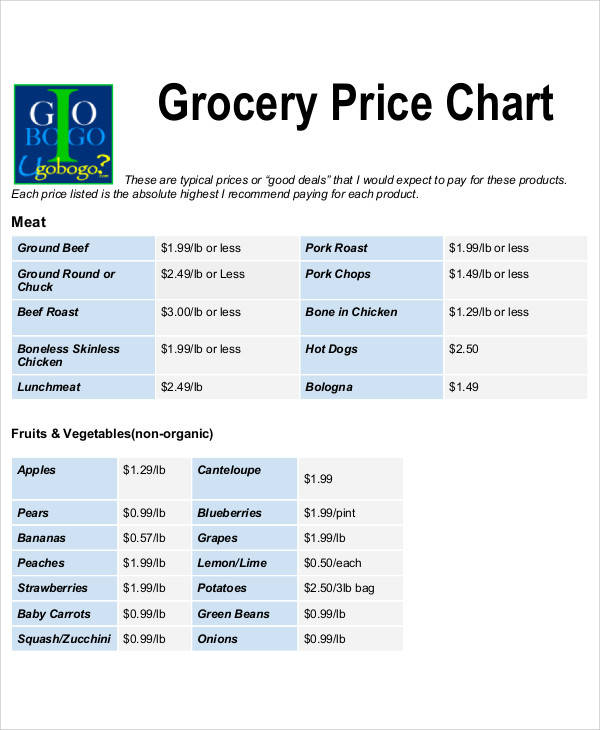
Grocery Price Chart Template
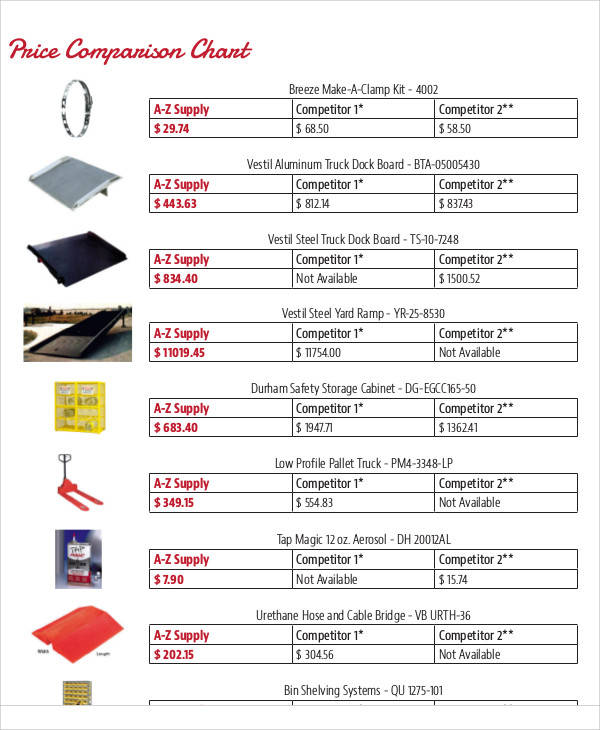
Price Comparison Chart
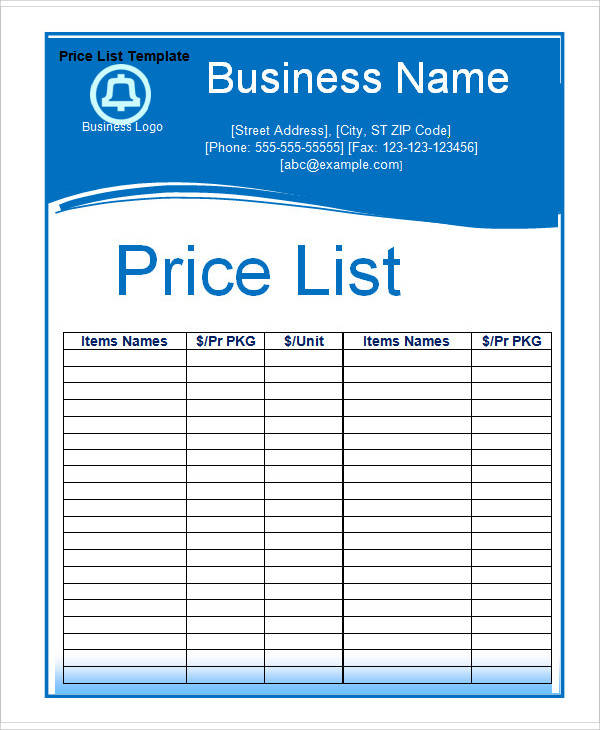
Price List Chart
Uses of a Price Chart
- A price chart can be used by business entity to provide info about the prices of the commodities and items that they offer to their customer, consumers, or clients.
- Price charts may also be applicable to identify the range of prices in which items can be grouped together depending on their price points, just like those in our free charts.
- A price can also be a comparison of the previous and current pricing systems that are being followed by enterprises and other establishments. This is usually done for price referencing needed for operational and product or service offer development.
Types of Stock Price Chart
There is actually no strict ruling in creating a stock price chart, unlike an organized color arrangement in a color chart, as the content of this document varies on the nature of its usage. A stock price chart can be any of the following.
- It can be a chart that showcases the significant differences of a variety of stocks in the same marketplace or market area.
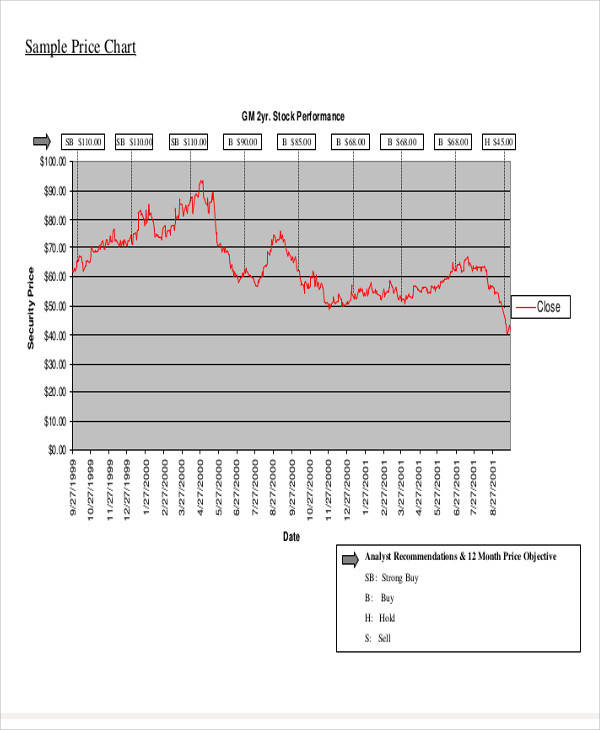
- A stock price chart may also refer to the stock prices and the changes that may happen into them, which is a part of a particular business’ operations.
You might also find our time charts useful.
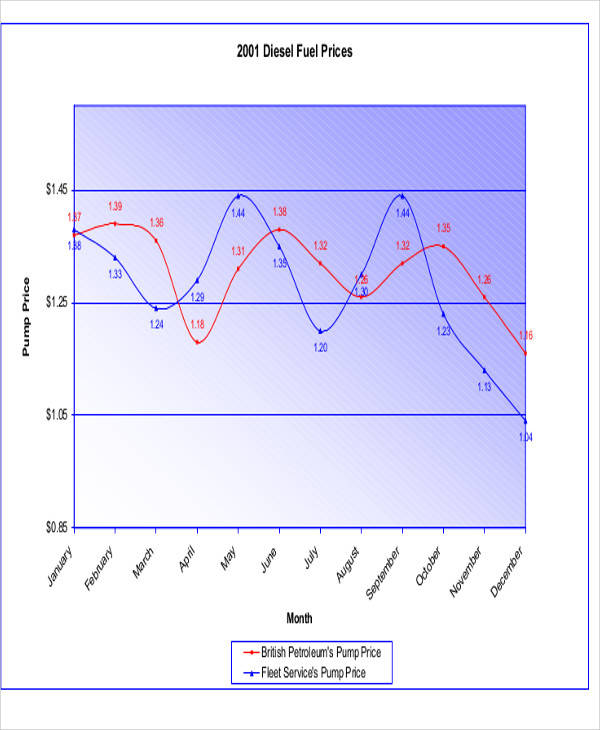
Fuel Price Chart Template
Sample Price Chart
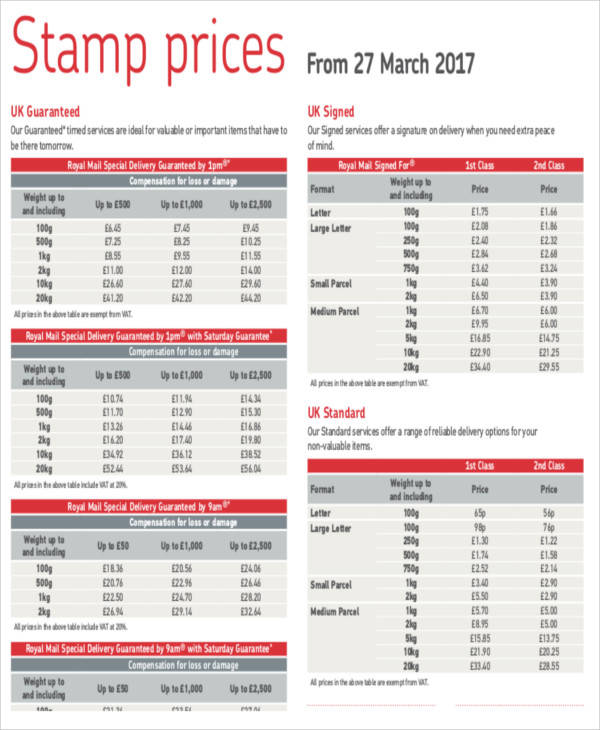
Chart for Stamp Price
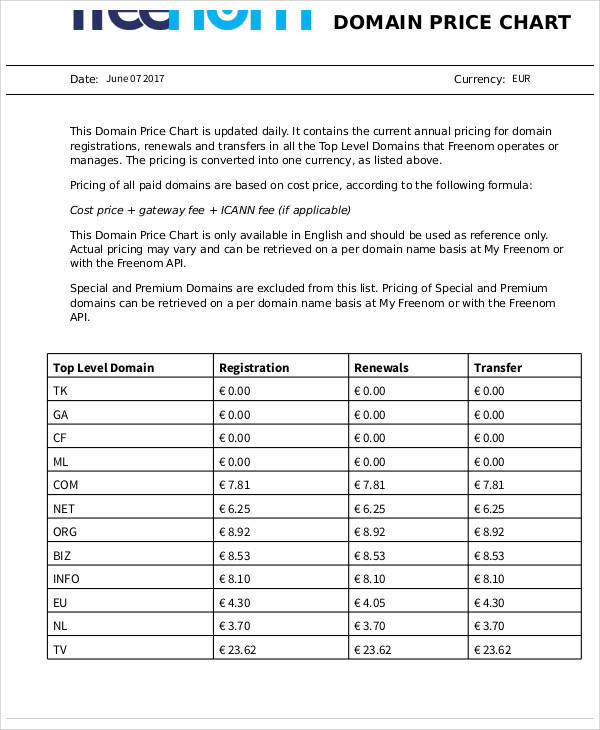
Domain Price Chart
General Price Chart
What Is Price by Volume Chart?
A price by volume chart is a graphical representation of the changes that happens in the prices of stocks depending on the variations of their volume through time in a specific period or duration. This means that a price by volume chart is a histogram that provides information about the movement of prices and the volume of goods involved within a stock. If you need to use a price by volume chart, it is available as a printable chart.
Tips to Make Effective Price Chart
- Use the best chart layout for your price chart.
- Add a title so that the customers and the staff will know that the chart is for the prices.
- Use a simple and easy to read font style and use a font size that is big enough to be read.
- Arrange the list of your products in alphabetical order. It will be easier to find the items if their names are arranged in alphabetical order.
- Make sure to update your price chart every time you make changes to their prices. Remember that your customers and employees will look at the price chart when pricing the products.
There are also other charts that are available online, just like a Gantt chart.
Related Posts
FREE 10+ Seat Chart Samples in PDF
FREE 10+ Pie Chart Samples in PDF
Free 3+ Eye Color Chart Samples in PDF
FREE 10+ Family Chore Chart Samples in PDF
FREE 10+ Classroom Chart Samples in PDF
FREE 10+ Genealogy Chart Samples in PDF
FREE 10+ Shipping Chart Samples in PDF
FREE 10+ Goal Chart Samples in PDF
FREE 10+ Character Chart Samples in PDF
FREE 10+ Table Seating Chart Samples in PDF
FREE 10+ Classroom Seating Chart Samples in PDF
FREE 10+ Grade Chart Samples in PDF
FREE 10+ Workflow Chart Samples in PDF
FREE 10+ Budget Chart Samples in PDF
FREE 10+ Process Flow Chart Samples in PDF
