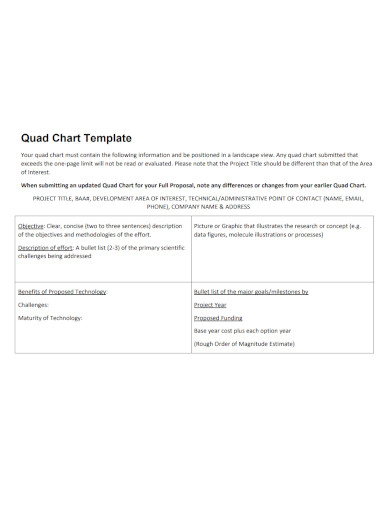
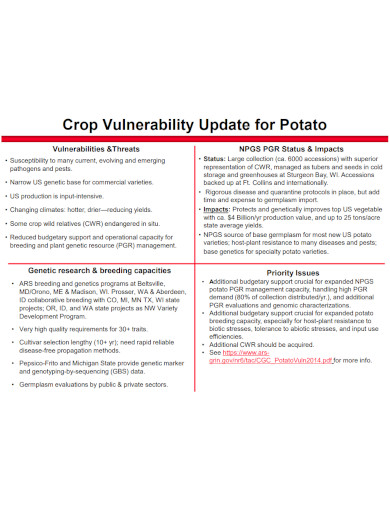
The first quadrant of a quad chart typically contains background information about the project scope or proposal samples. This includes a brief profile summary of the purpose of the project, its objectives, and any relevant background information. This quadrant sets the stage for the rest of the quad chart and helps the viewer understand the context of the information presented in the other quadrants.
The second quadrant of a quad chart contains the key points of the project or proposal. This is where the most important information is presented, such as the benefits of the project, challenges, and key features. It is important to present this information in a clear and concise way, so that the viewer can easily understand the most critical aspects of the project.
7+ Quad Chart Samples in PDF
1. Quad Chart Template Example
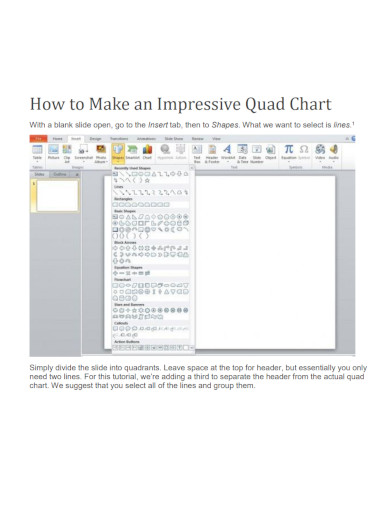
2. Impressive Quad Chart
3. Sample Quad Chart
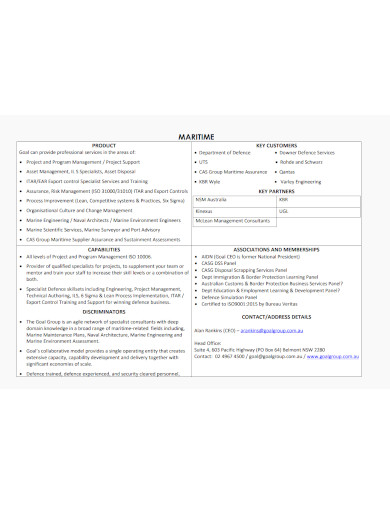
4. Martime Quad Chart Template
5. Author Quad Chart Template
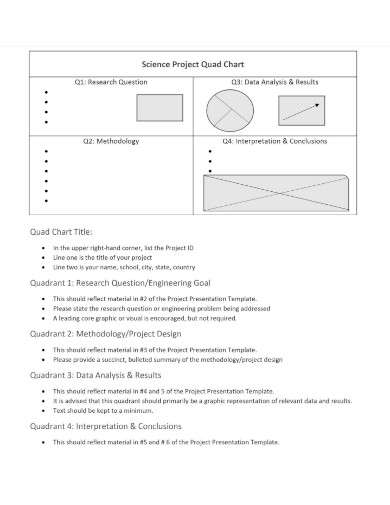
6. Science Project Quad Chart
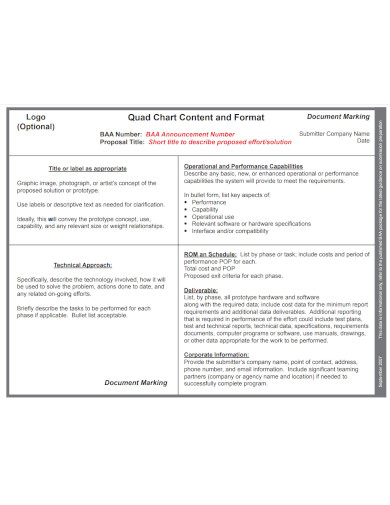
7. Quad Chart Content and Format
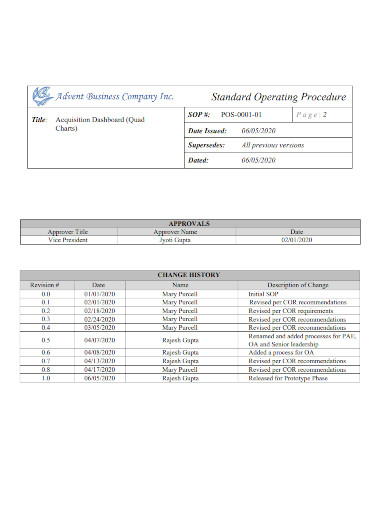
8. Standard Operating Procedure of Quad Charts
What is Quad Chart?
Quad charts are a powerful visual tool used to present complex information in a simple and concise manner. They are used in business plan, military/army chart, and government to provide a project overview, proposal or work plan strategy. A quad chart is a single slide that is divided into four quadrants, each containing different types of information. The purpose of a quad chart is to provide a quick and easy way for people to understand complex ideas and to make informed decisions.
How To Make Quad Chart?
Quad charts are useful because they allow viewers to quickly grasp the key points of a project or proposal without having to sift through pages of information. They are often used in presentations or as handouts during creative meeting agendas or briefings. Creating a quad chart can be a simple process if you follow a few basic steps. Here are the steps to create a quad chart:
Step 1- Determine The Purpose
Before creating a quad chart, you need to decide on the purpose of the chart and the content you want to include. Identify the key points you want to make and the information you want to convey.
Step 2- Divide into Four
Once you have decided on the content you want to include, divide the slide into four equal quadrants. This can be done using the layout tools in your presentation software.
Step 3- Populate Each Quadrant
Start filling in each quadrant with the appropriate information. The first quadrant should contain background information about the project or proposal, the second should contain the key points, the third should contain relevant graphics or images, and the fourth should summarize the key takeaways and next steps.
Step 4- Clear and Concise
When creating a quad chart, it’s important to use clear and concise language. Avoid using complex language or jargon that could be confusing to the viewer. Use visuals, such as flowchart samples, graphs, and images, to enhance the message you are trying to convey. Make sure the visuals are relevant to the information presented in each quadrant and that they are easy to understand.
What are the uses of a quad chart?
Quad charts are commonly used in business, military, and government settings to provide a quick overview of a project or proposal.
What is included in a quad chart?
A quad chart typically contains background information about the project or proposal, key points, graphics or images that help to illustrate the key points, and a conclusion or next steps section.
Can I download free quad chart samples in PDF?
Yes, there are many websites that offer free quad chart samples in PDF that you can download and use as a reference list or template for creating your own quad charts.
In conclusion, a quad chart is a powerful visual tool that can be used to present complex information in a simple and concise manner. It is a useful tool for presenting projects, proposals, or strategies and can be used in various fields such as business, military, and government. By following the format of the four quadrants, it is possible to present complex information in a way that is easy to understand and make informed decisions. Quad charts can be used as a standalone tool or as part of a presentation, making them a valuable addition to any communication strategy.
Related Posts
FREE 10+ Pie Chart Samples in PDF
Free 3+ Eye Color Chart Samples in PDF
FREE 10+ Family Chore Chart Samples in PDF
FREE 10+ Classroom Chart Samples in PDF
FREE 10+ Genealogy Chart Samples in PDF
FREE 10+ Shipping Chart Samples in PDF
FREE 10+ Goal Chart Samples in PDF
FREE 10+ Character Chart Samples in PDF
FREE 10+ Table Seating Chart Samples in PDF
FREE 10+ Classroom Seating Chart Samples in PDF
FREE 10+ Grade Chart Samples in PDF
FREE 10+ Workflow Chart Samples in PDF
FREE 10+ Budget Chart Samples in PDF
FREE 10+ Process Flow Chart Samples in PDF
FREE 10+ Medication Chart Samples in PDF | DOC

