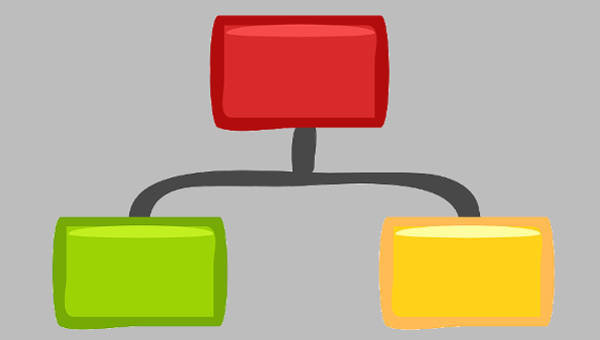
Charts are graphical representations of any information or data and are displayed using a table, graph, or diagram. The information in the chart is represented through lines, bars, or sections. An organizational chart is a type of chart that displays the relationships between the different departments in a company.
There are various types of charts that can be used depending on how you want to display information. A pie chart is a type of chart that is used to display proportions or a certain percentage of a particular data or information. If you want to learn more about flowcharts, read more about it below.
What Are the Types of Flowcharts?
There are different types of flowcharts that can be used depending on how an individual wants an information to be represented. The various types of flowcharts are as follows:
- Basic Flowchart – a basic flowchart is a type of chart that is formatted in a simple way. It contains the essential elements that a basic flowchart contains.
- Cross-Functional Flowchart – a cross-functional flowchart is also a simple type of chart but it contains detailed information. This type of chart is useful in business planning.
- Data Flow Diagram – this type of chart is mainly used in information systems.
Why Use a Flowchart?
A flowchart is a type of chart that displays the workflow or process of a particular data. This type of chart uses boxes and lines to display information and is important to accurately show the process or procedure for the purpose of improving it. It helps organizations or businesses to identify and understand the process in order to make adjustments and changes to the operations of a particular task. It is an important tool to be able to visualize different processes.
Additionally, there are rate charts and printable chart templates available on this page if you need that type specifically.
How to Create a Basic Flowchart
- The first step in creating a flowchart is to download a template to make it easier for you to create one. You can download them from the free charts that are available on this page.
- Gather all the information that you will need to create your flowchart.
- Using the boxes in your template, write all the information based on the data that you have gathered.
- Connect the boxes using lines to symbolize the workflow or the process of the information that you have written.
What Is the Difference between a Workflow and a Flowchart?
Although a workflow and a flowchart are important in business, both terms are different. The differences between a workflow and a flowchart are as follows:
- Workflow – A workflow refers to the processes or procedures that define how tasks are completed in the operations of the business. It clearly describes the steps or the sequence of activities that happen within the business on how certain tasks are completed.
- Flowchart – A flowchart is a tool where the processes in the workflow are visualized. This is where the steps are illustrated and are important in helping individuals understand how these processes work allowing them to complete these tasks.
Related Posts
FREE 10+ Seat Chart Samples in PDF
FREE 10+ Pie Chart Samples in PDF
Free 3+ Eye Color Chart Samples in PDF
FREE 10+ Family Chore Chart Samples in PDF
FREE 10+ Classroom Chart Samples in PDF
FREE 10+ Genealogy Chart Samples in PDF
FREE 10+ Shipping Chart Samples in PDF
FREE 10+ Goal Chart Samples in PDF
FREE 10+ Character Chart Samples in PDF
FREE 10+ Table Seating Chart Samples in PDF
FREE 10+ Classroom Seating Chart Samples in PDF
FREE 10+ Grade Chart Samples in PDF
FREE 10+ Workflow Chart Samples in PDF
FREE 10+ Budget Chart Samples in PDF
FREE 10+ Process Flow Chart Samples in PDF
