
Unlock the power of data analysis with our Sample Correlation Coefficient template! In the world of statistics, understanding correlations is key to extracting valuable insights from your data. Our user-friendly template simplifies the process, allowing you to effortlessly calculate and interpret sample correlation coefficients in accordance with APA format. Whether you’re a data enthusiast, a student, or a professional, this tool will enhance your analytical skills and help you uncover hidden connections within your datasets. Say goodbye to data ambiguity and hello to precise, data-driven decisions with our Sample Correlation Coefficient template, APA compliant.
20+ Correlation Coefficient Samples
1. Correlation Coefficient Template
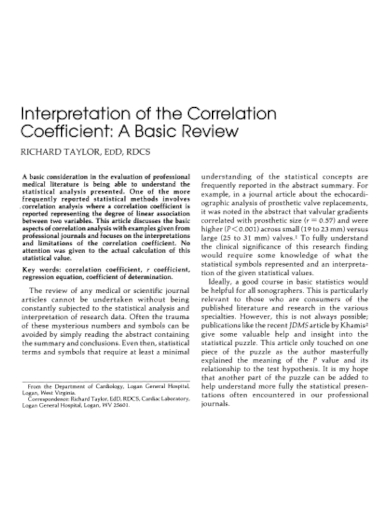
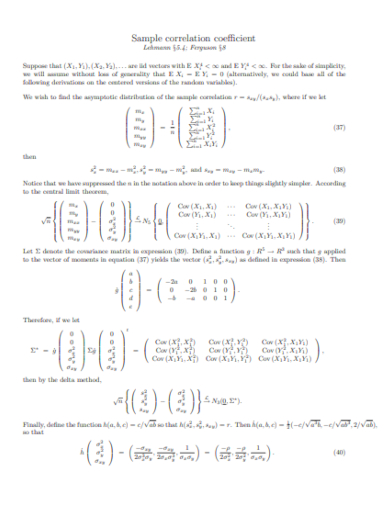
2. Sample Correlation Coefficient
3. Correlation Coefficient Formula
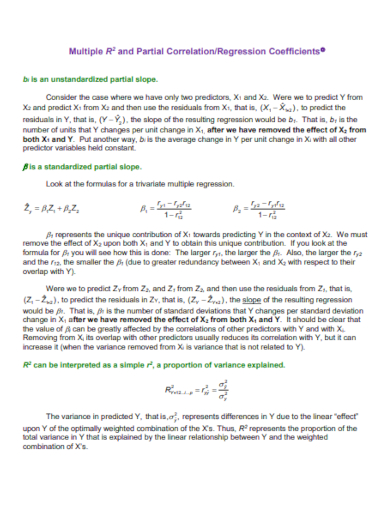
4. Partial Correlation Regression Coefficient
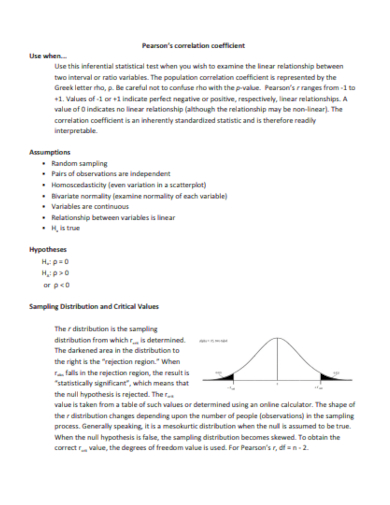
5. Pearson Correlation Coefficient
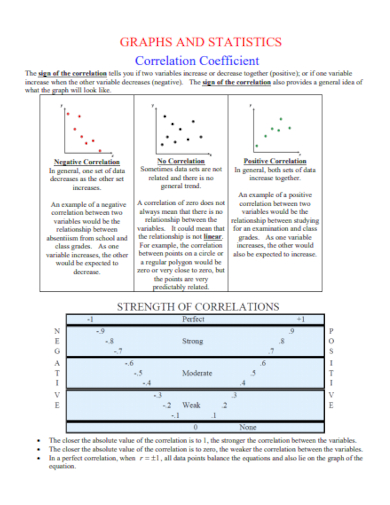
6. Graphs and Statistics Correlation Coefficient
What is a correlation coefficient?
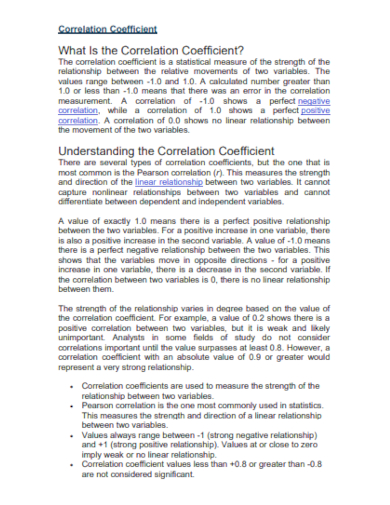
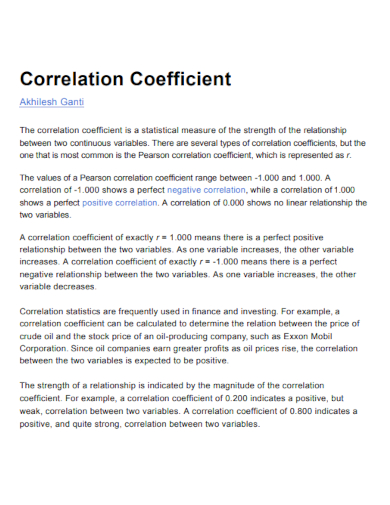
A correlation coefficient is a statistical measure that quantifies the strength and direction of the linear relationship between two variables. In other words, it helps us understand how two variables change in relation to each other. This concept is fundamental in the field of statistics and plays a crucial role in data analysis, research, and decision-making across various disciplines, including economics, psychology, biology, and social sciences.
The most commonly used correlation coefficient is the Pearson correlation coefficient, denoted as “r.” It ranges from -1 to 1, where:
If r is close to 1, it indicates a strong positive correlation, meaning that as one variable increases, the other tends to increase as well.
If r is close to -1, it signifies a strong negative correlation, indicating that as one variable increases, the other tends to decrease.
When r is close to 0, it suggests a weak or no linear relationship between the variables.
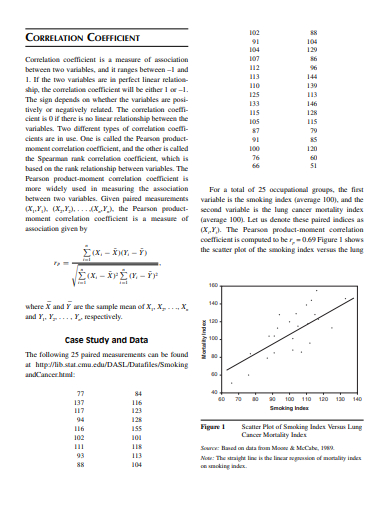
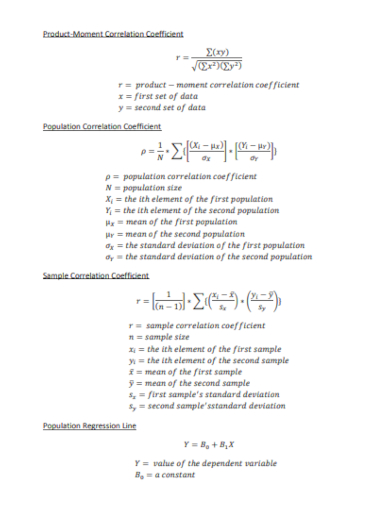
To calculate the Pearson correlation coefficient, you need a dataset with pairs of values for the two variables you want to analyze. The formula for r involves several steps, including finding the means and standard deviations of the variables. Once calculated, the value of r provides important insights into the relationship between the variables.
For example, in a study examining the relationship between study hours and exam scores, a positive correlation coefficient close to 1 would suggest that as students spend more time studying, their exam scores tend to be higher. Conversely, a negative correlation coefficient close to -1 would imply that as study hours increase, exam scores tend to decrease. A coefficient close to 0 would suggest that there is no significant linear relationship between study hours and exam scores.
It’s important to note that correlation does not imply causation. Even if two variables have a strong correlation, it does not necessarily mean that one variable causes the other to change. Correlation simply quantifies the degree of association between the variables.
Correlation coefficients are not limited to the Pearson correlation. There are other types of correlation coefficients, such as the Spearman rank correlation and the Kendall tau rank correlation, which are used when dealing with non-linear relationships or ordinal data.
In summary, a correlation coefficient is a valuable statistical tool that helps researchers and analysts understand how two variables are related. It provides a numerical representation of the strength and direction of their linear relationship and is widely used in various fields to make informed decisions based on data analysis.
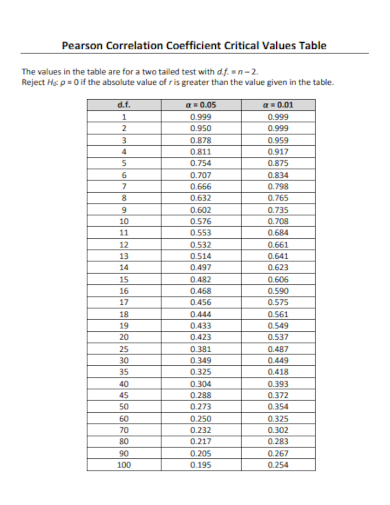
7. Correlation Coefficient Values Table
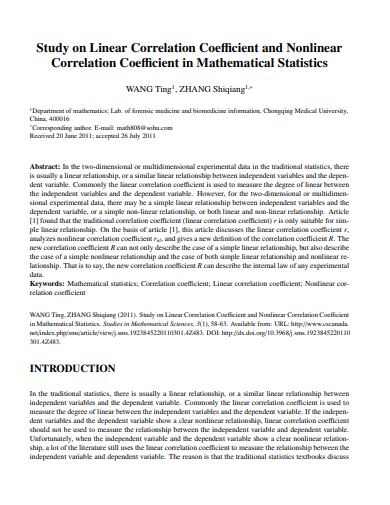
8. Linear Correlation Coefficient
9. Interpretation of Correlation Coefficient
10. Math Correlation Coefficient
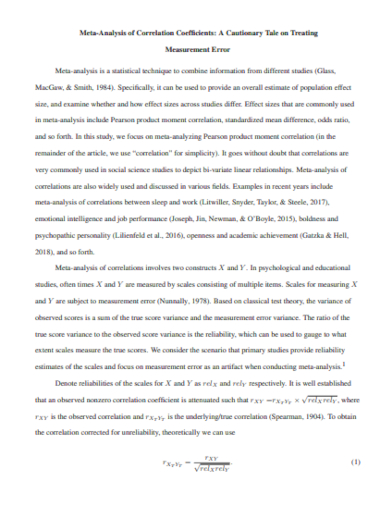
11. Measurement Scale Correlation Coefficient
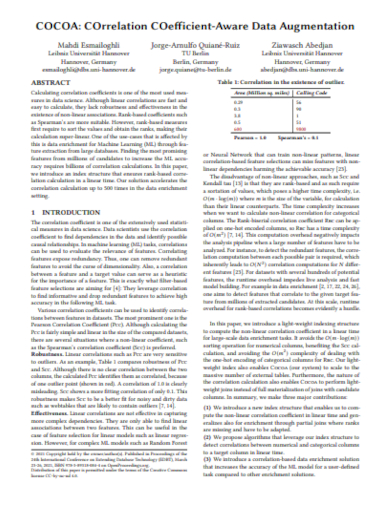
12. Correlation Coefficient Data Augmentation
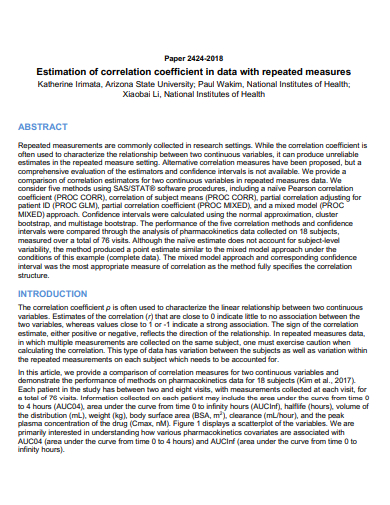
13. Estimation of Correlation Coefficient Data
How to calculate the correlation coefficient?
Calculating the correlation coefficient, typically denoted as “r,” is a fundamental statistical process that quantifies the strength and direction of the linear relationship between two variables. This coefficient is essential for understanding the degree to which changes in one variable are associated with changes in another. Here’s a step-by-step guide on how to calculate the correlation coefficient:
Step 1: Gather Your Data:
To calculate the correlation coefficient, you need a dataset that includes paired observations of the two variables you want to analyze. For instance, you might collect data on the number of hours studied and the corresponding exam scores for a group of students.
Step 2: Compute the Mean (Average):
Calculate the mean (average) of each variable. To find the mean, add up all the values of a variable and divide by the total number of observations. Let’s denote the means as x? (for one variable) and ? (for the other variable).
Step 3: Calculate the Deviations:
For each data point, subtract the mean of its respective variable from the actual value. These are called deviations. You’ll have two sets of deviations, one for each variable. Denote these deviations as (x – x?) and (y – ?).
Step 4: Multiply the Deviations:
Multiply each pair of deviations (x – x?) and (y – ?) together. This creates a new set of values. The product of these deviations represents how the data points vary together.
Step 5: Calculate the Sum of the Product of Deviations:
Add up all the products of deviations calculated in the previous step. This sum is the numerator of the correlation coefficient formula.
Step 6: Calculate the Sum of Squares of Deviations:
Now, square each deviation individually [(x – x?)^2 and (y – ?)^2], and sum these squared values. This sum is the denominator of the correlation coefficient formula.
Step 7: Calculate the Correlation Coefficient (r):
Finally, divide the sum of the products of deviations (from Step 5) by the square root of the product of the sums of squared deviations (from Step 6). The formula for r is:
r=?((x?x?)2)?((y?y?)2)?((x?x?)(y?y?))
The resulting value of r will fall within the range of -1 to 1:
If r is close to 1, it indicates a strong positive correlation, suggesting that as one variable increases, the other tends to increase as well.
If r is close to -1, it indicates a strong negative correlation, implying that as one variable increases, the other tends to decrease.
If r is close to 0, it suggests a weak or no linear relationship between the variables.
It’s important to note that correlation does not imply causation. Even if two variables have a strong correlation, it does not necessarily mean that one variable causes the other to change. Correlation simply quantifies the degree of association between the variables, and causation requires further investigation and analysis.
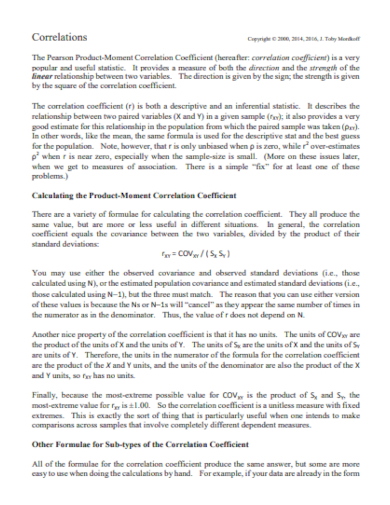
14. Product Moment Correlation Coefficient
15. Strong Correlation Coefficient
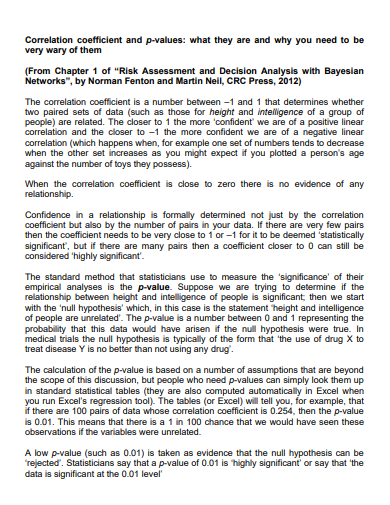
16. Risk Assessment Correlation Coefficient
17. Population Correlation Coefficient
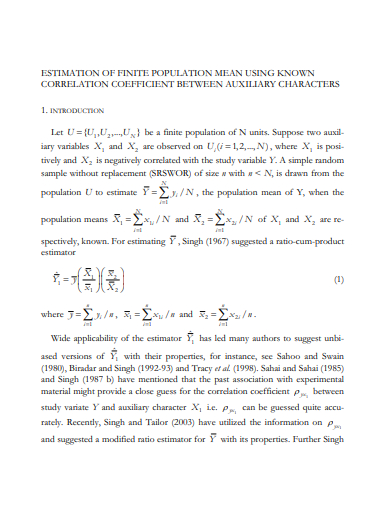
18. Population Mean Correlation Coefficient
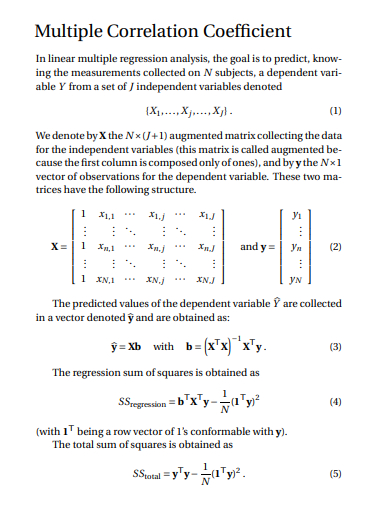
19. Multiple Correlation Coefficient Template
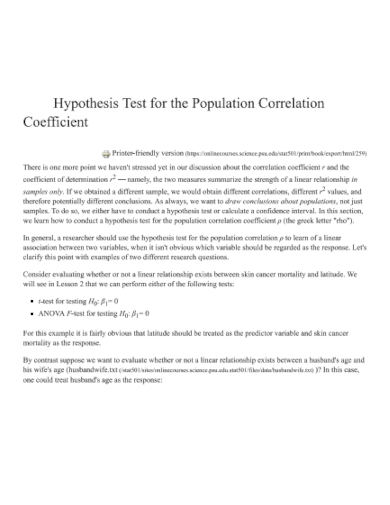
20. Hypothesis Test for Correlation Coefficient
21. Standard Rank Correlation Coefficient
How to do a correlation coefficient in Excel?
Calculating the correlation coefficient in Excel is a straightforward process and can be done using Excel’s built-in functions. Here’s a step-by-step guide on how to do it:
Step 1: Organize Your Data:
Ensure that your data is well-organized in Excel with one variable in one column and the other variable in another column. For example, if you want to calculate the correlation between study hours and exam scores, you might have one column for study hours and another for exam scores.
Step 2: Select the Data:
Click and drag to select the data for both variables. Make sure you include the column headers so Excel knows what the data represents.
Step 3: Use the CORREL Function:
Excel provides a function called “CORREL” to calculate the correlation coefficient. To use it, follow these steps:
Click on an empty cell where you want to display the correlation coefficient.
Type “=CORREL(” in the cell.
Step 4: Select the Data Ranges:
Select the data range for the first variable by clicking and dragging. After selecting the first range, type a comma to separate it from the second range.
Type a comma (,) to separate the two data ranges.
Step 5: Select the Data Range for the Second Variable:
Select the data range for the second variable by clicking and dragging it. After selecting both data ranges, close the parentheses.
After selecting both data ranges, close the parentheses by typing “)”.
Step 6: Press Enter:
Press the “Enter” key, and Excel will calculate the correlation coefficient (r) for your data.
The cell you selected will now display the correlation coefficient between the two variables. The resulting value of “r” will fall within the range of -1 to 1:
If “r” is close to 1, it indicates a strong positive correlation, meaning that as one variable increases, the other tends to increase as well.
If “r” is close to -1, it indicates a strong negative correlation, indicating that as one variable increases, the other tends to decrease.
If “r” is close to 0, it suggests a weak or no linear relationship between the variables.
Excel also provides a scatterplot feature that allows you to visualize the relationship between the two variables, making it easier to interpret the correlation coefficient.
To create a scatterplot:
Step 7: Create a Scatterplot:
Highlight your data.
Go to the “Insert” tab.
Click on “Scatter” and choose the scatterplot type that suits your data.
This scatterplot can help you visualize the correlation between the two variables and understand whether the relationship is positive, negative, or weak.
In summary, calculating the correlation coefficient in Excel is a simple process using the CORREL function. Once you have the correlation coefficient, you can interpret it to understand the relationship between your variables, which is valuable for data analysis and decision-making.
Related Posts
Sample Business Card Templates
Sample Cashier Job Descriptions
Questionnaire Samples
FREE 10+ Sample HR Resource Templates in PDF
FREE 10+ HR Consulting Business Plan Samples in MS Word | Google Docs | Pages | PDF
FREE 49+ Sample Job Descriptions in PDF | MS Word
FREE 16+ Nonprofit Budget Samples in PDF | MS Word | Excel | Google Docs | Google Sheets | Numbers | Pages
FREE 13+ Academic Calendar Templates in Google Docs | MS Word | Pages | PDF
FREE 10+ How to Create an Executive Summary Samples in Google Docs | MS Word | Pages | PDF
FREE 23+ Sample Event Calendar Templates in PDF | MS Word | Google Docs | Apple Pages
Company Profile Samples
FREE 10+ Leadership Report Samples [ Development, Training, Camp ]
FREE 24+ Sample Payment Schedules in PDF | MS Word
FREE 10+ Return to Work Action Plan Samples in PDF | DOC
Autobiography Samples & Templates