One of the key benefits of using infographic samples is their ability to simplify complex information. Data that might be overwhelming or difficult to interpret in a text-heavy format can be presented in a more digestible way through the use of graphics and visual aids. This can help the audience to better understand the information being presented, and to retain it for longer periods of time.
15+ Infographic Samples
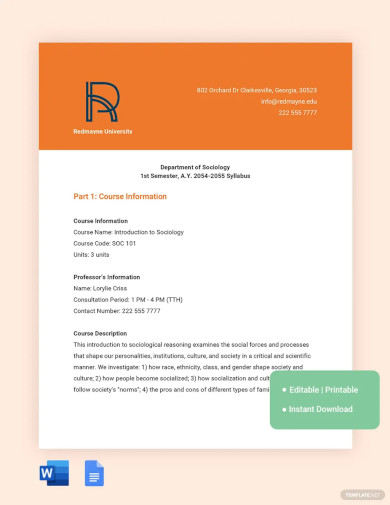
1. Infographic Syllabus Template
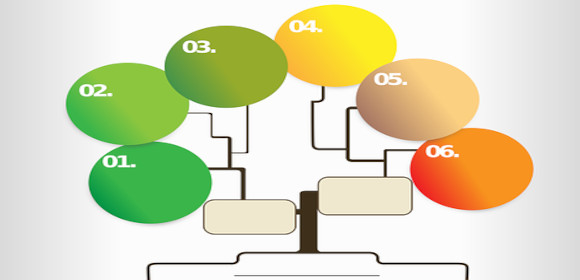
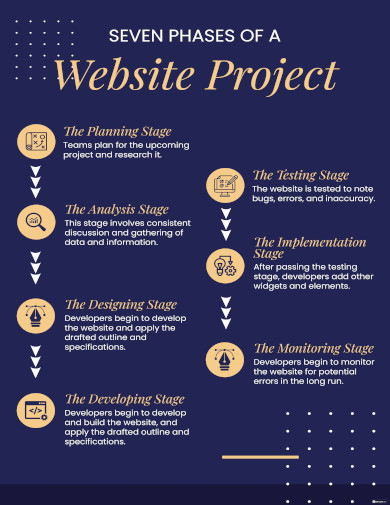
2. Project Infographic Template
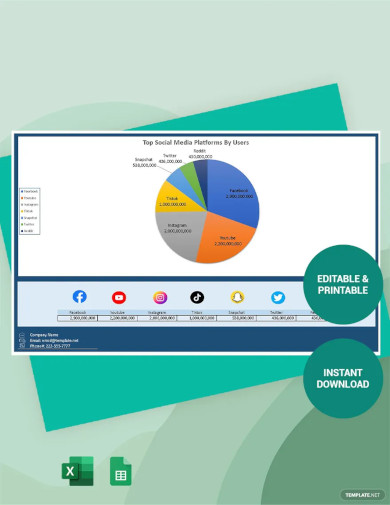
3. Infographic Pie Chart Template
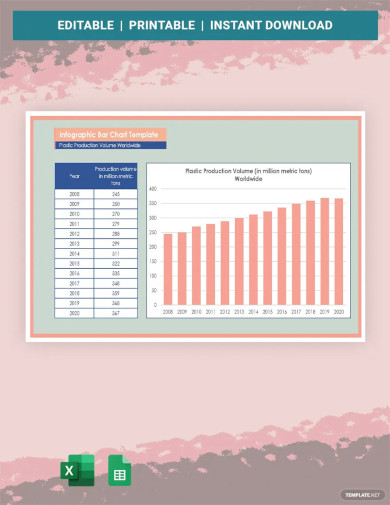
4. Infographic Bar Chart Template
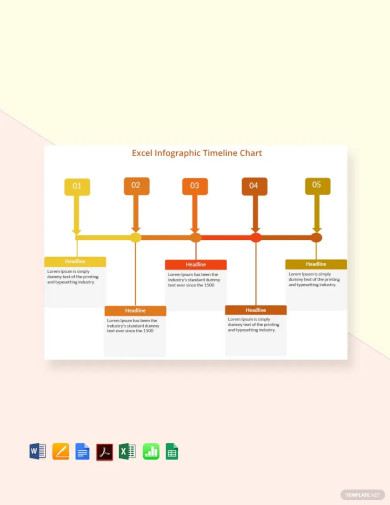
5. Timeline Infographic Chart Template
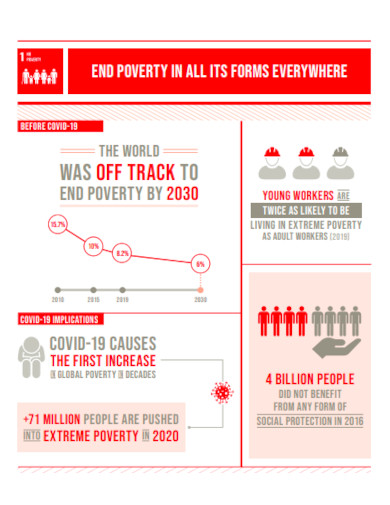
6. Poverty Infographic Template
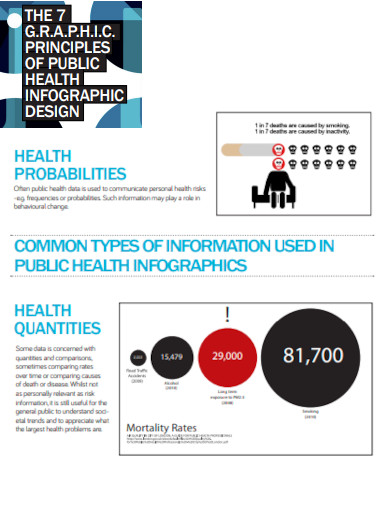
7. Public Health Infographic Template
8. Iceberg Infographic Template
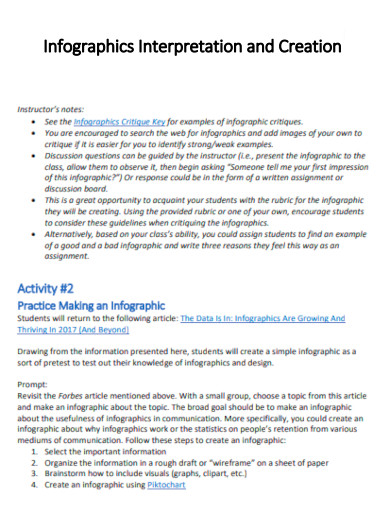
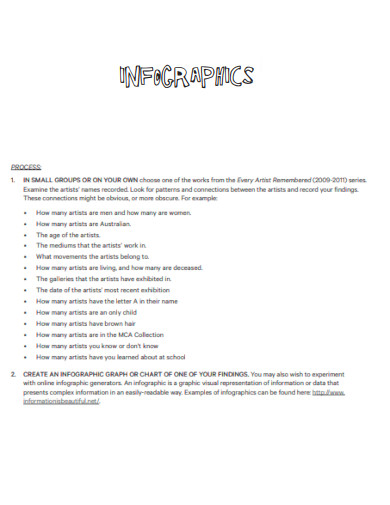
9. Infographics Interpretation and Creation Template
10. Career Cluster Infographics Template
11. Simple Infographics Template
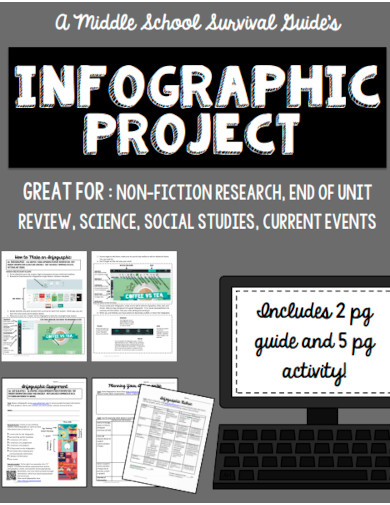
12. Infographics Project Template
13. Disinformation Infographic Template
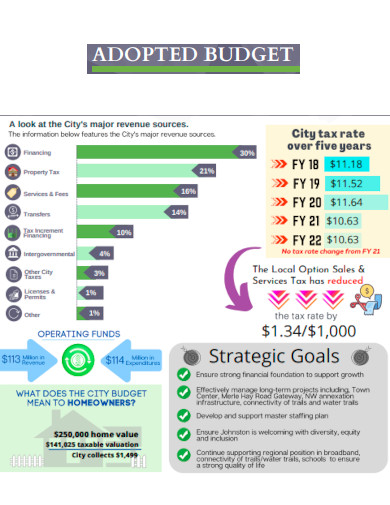
14. Adopted Budget Infographic Template
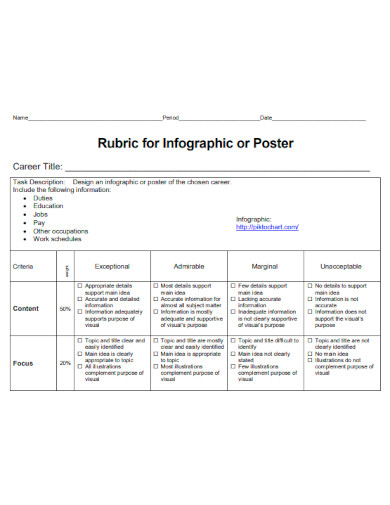
15. Rubric for Infographic Template
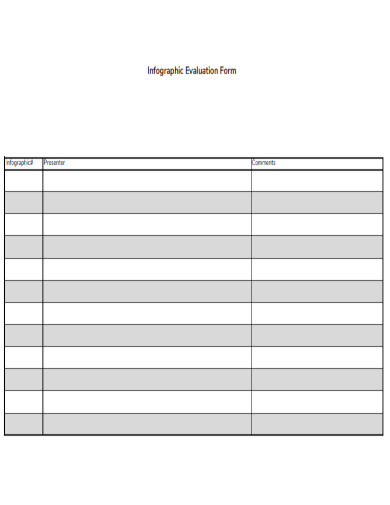
16. Infographic Evaluation Form
What is Infographic Samples?
Infographic samples are visual representations of information, data, or knowledge that are designed to make complex ideas or statistics more accessible and easier to understand. They are typically created using a combination of graphics, charts, icons, and text to convey a message or tell a story.
How To Make Infographic Samples?
Infographic samples can be used for a variety of purposes, including marketing, education, journalism, and data analysis. For example, a company might create an infographic sample to promote a new product or service, while a nonprofit organization might use one to raise awareness about a particular issue. Making infographic samples requires a combination of design skills and knowledge of the subject matter. Here are some general steps to follow when creating an infographic sample:
Step 1- Determine Topic and Purpose
The first step in making an infographic sample is to determine the topic you want to cover and the purpose of the infographic. What message do you want to convey, and who is your target audience? Before creating your infographic sample, it’s important to research your topic thoroughly. Collect data and information from reputable sources, and organize it into a logical structure.
Step 2- Choose a Layout
Choose a layout for your infographic sample that suits your purpose and topic. Consider the type of information you want to present and the story you want to tell. Choose a color scheme that complements the topic and message of your infographic. Use colors that are easy on the eyes and that highlight important information.
Step 3- Design Infographic
Use design software such as Adobe Illustrator or Canva to create your infographic sample. Use graphics, icons, and text to visually represent your data and information. Once you have created your infographic sample, edit and refine it. Check for errors, ensure that the layout is clear and easy to read, and make sure that the design elements are visually appealing.
Step 4- Share and Promote
Once your infographic sample is complete, share it on social media, your website, or other relevant platforms. Consider promoting it to your target audience to increase its reach and impact.
What are some common types of infographic samples?
There are many different types of infographic samples, including statistical infographics, timeline infographics, process infographics, comparison infographics, and geographic infographics.
How do you create an infographic sample?
To create an infographic sample, you should first determine your topic and purpose, research your topic, choose a layout and color scheme, design your infographic using design software, edit and refine it, and then share and promote it.
What software can be used to create infographic samples?
There are many design software options available to create infographic samples, such as Adobe Illustrator, Canva, Piktochart, and Venngage.
In conclusion, infographic samples are a powerful tool for presenting complex information in a visually appealing and accessible way. They can be used in a wide range of contexts, and there are several different types of infographic samples to choose from. When designing an infographic sample, it is important to consider the audience and the message being conveyed, and to create a design that is visually appealing and easy to read. With these considerations in mind, infographic samples can be an effective way to communicate complex information to a wide audience.
Related Posts
Retirement Speech Samples & Templates
Weekly Schedule Samples & Templates
Contractual Agreement Samples & Templates
FREE 9+ Amazing Sample Church Bulletin Templates in PSD | PDF
Sample Business Card Templates
Sample Cashier Job Descriptions
Questionnaire Samples
FREE 10+ Sample HR Resource Templates in PDF
FREE 10+ HR Consulting Business Plan Samples in MS Word | Google Docs | Pages | PDF
FREE 49+ Sample Job Descriptions in PDF | MS Word
FREE 13+ Academic Calendar Templates in Google Docs | MS Word | Pages | PDF
FREE 10+ How to Create an Executive Summary Samples in Google Docs | MS Word | Pages | PDF
FREE 23+ Sample Event Calendar Templates in PDF | MS Word | Google Docs | Apple Pages
Company Profile Samples
FREE 10+ Leadership Report Samples [ Development, Training, Camp ]
