
A Normal Lab Values Chart includes results of various types of tests along with the Standard prescribed value of each of them in SI units. These Chart Templates are in the form of a blank table with each column namely test, specimen, and conventional unit and SI unit. Acetate and ammonia are some basic tests included that may help you in future for reference purposes.
You can now create your own Normal Lab Values Chart selecting tests from our wide range of database and create a chart customizable to your needs. These can be downloaded in MS Word doc and Adobe Acrobat pdf format in easily printable files.
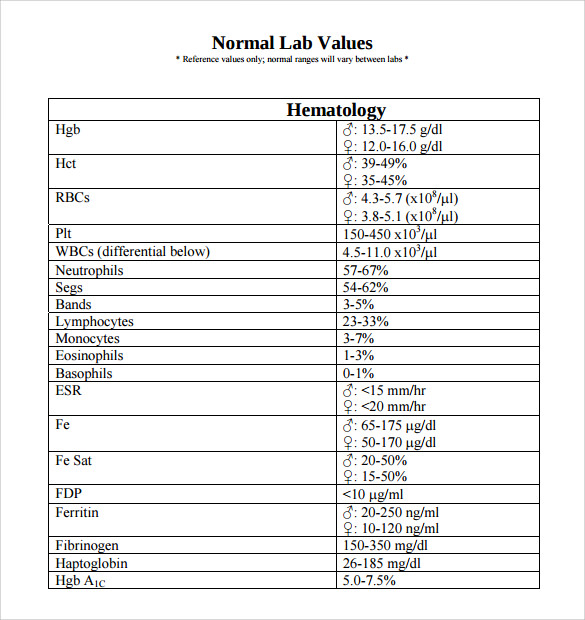
Normal Lab Values Chart Printable
This one is a simple lab values chart template that you can use to enlist the units and their reference range. You can easily print it out to keep with yourself as a reference for future. It is a simply designed lab value chart template that anyone can write and understand.
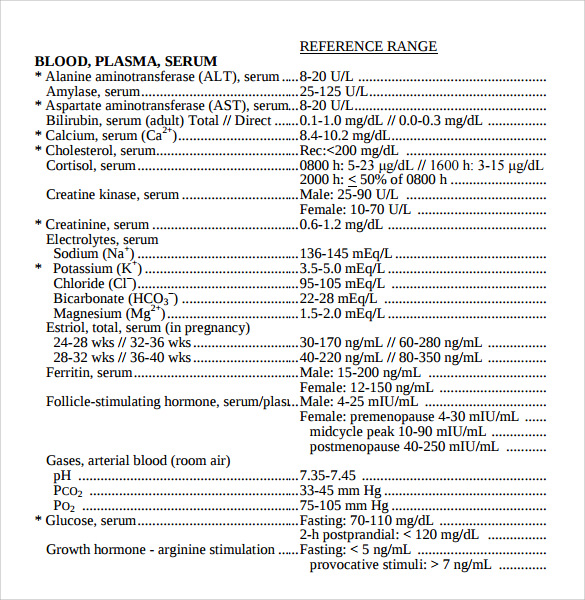
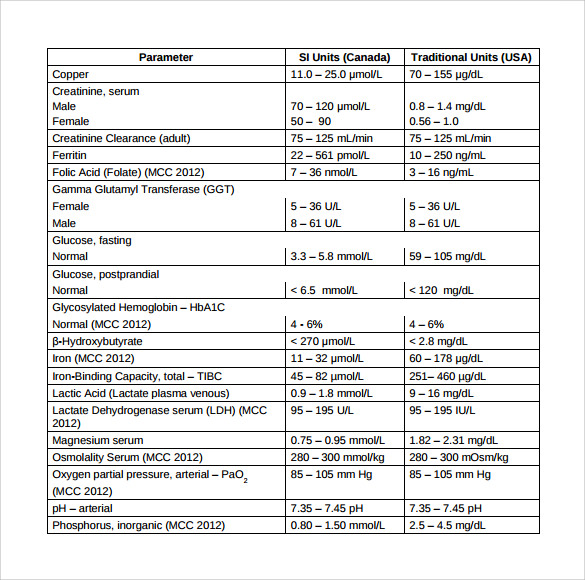
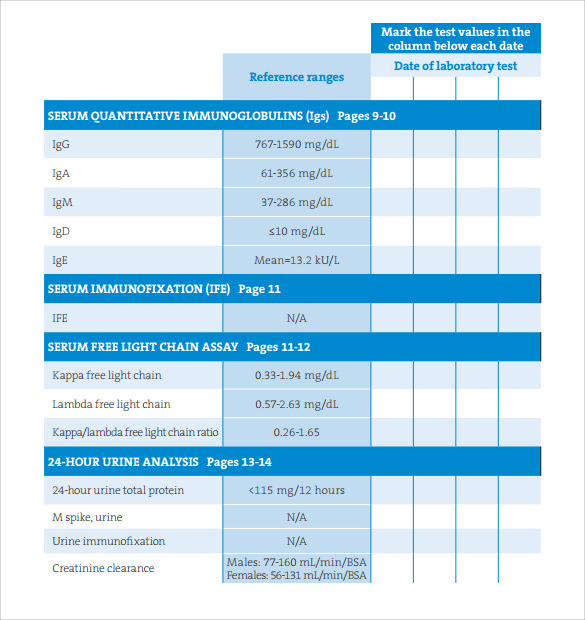
Normal Lab Values Chart 2015
This is a normal lab values chart available in a simple table. Units are specified on the left, and their reference range is mentioned on the right. There are a number of signs that have been used in the designing too. You can fill in the required details, and print it out for your future reference during the experiments and tests.
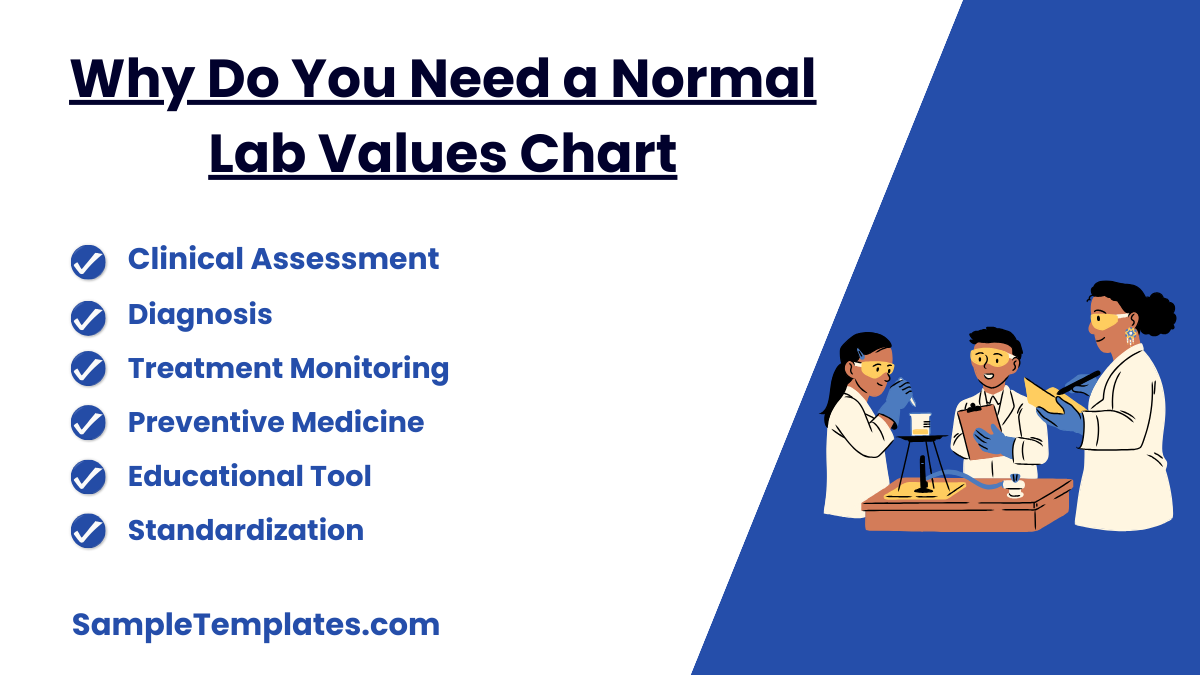
Why Do You Need a Normal Lab Values Chart?
These normal lab values chart templates are incredibly comprehensive, highly flexible, and powerfully versatile to create normal value charts for labs. These are easy to use, user-friendly, extremely intuitive, and multipurpose lab values chart templates. Each and every template has been designed with utmost attention to detail.
- Clinical Assessment: It provides healthcare professionals with baseline values for essential lab tests, which are necessary for assessing the health status of patients. By comparing a patient’s lab results with the normal ranges, clinicians can identify abnormalities that may indicate underlying health issues.
- Diagnosis: Many medical conditions are diagnosed based on deviations from normal lab values. For example, elevated white blood cell counts can indicate an infection, while low hemoglobin may suggest anemia. A chart helps in making these determinations quickly and accurately.
- Treatment Monitoring: For patients undergoing treatment, normal lab values serve as a guide to evaluate the effectiveness of treatment. Regular testing and comparison with these values help determine if the treatment is working or if adjustments are necessary.
- Preventive Medicine: Normal ranges can also be used to screen for diseases in asymptometric patients. Abnormal values may prompt further investigation even if the patient does not exhibit symptoms, allowing for early intervention.
- Educational Tool: For medical students and trainees, the chart is an educational resource that aids in learning about different tests, understanding their significance, and interpreting their results.
- Standardization: Normal Lab Values Charts help standardize medical assessments across different healthcare settings, ensuring consistency in how test results are interpreted by different professionals.
A dedicated team of developers and designers is behind the scenes to create these smooth, well-polished, fully functional lab values chart templates. You may like Decimal Place Value Charts.
Normal Lab Values Chart Nursing PDF
This one is a table format lab value nursing chart available in PDF format. You can easily download it on your desktop, make the necessary changes, and print it out to keep as a reference. It is easily customizable as per your individual requirements and preferences.
Normal Lab Values Chart for Pediatrics
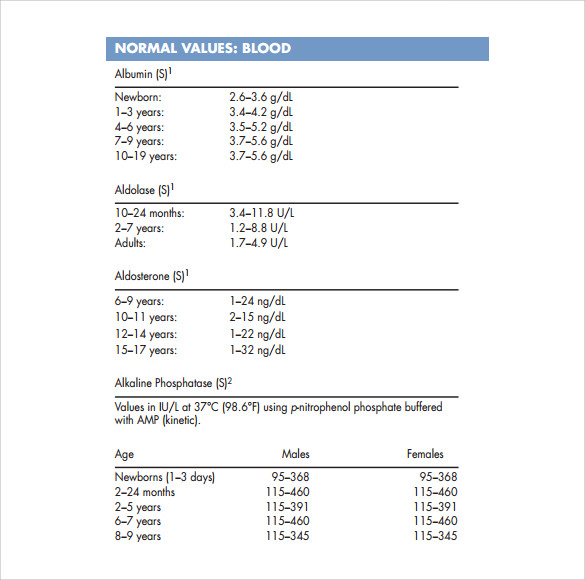
There are certain elements that are different in children than adults. That is why, lab values chart for children is also different from others. This is a normal lab values chart specifically designed for pediatrics. The values have been defined as per the age of the child, categorized into different age groups.
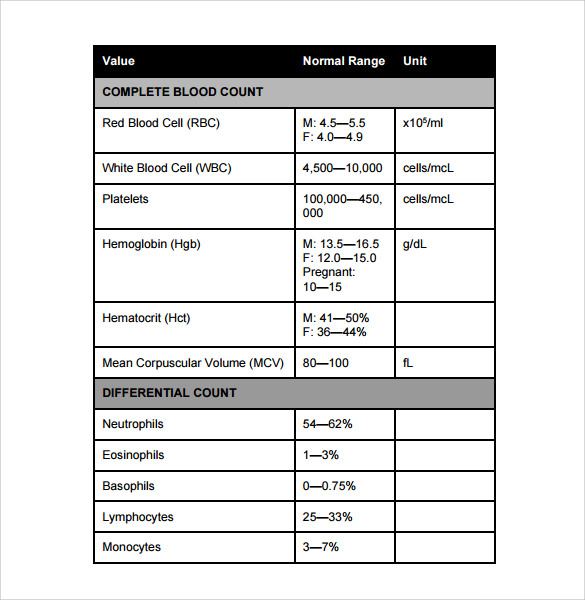
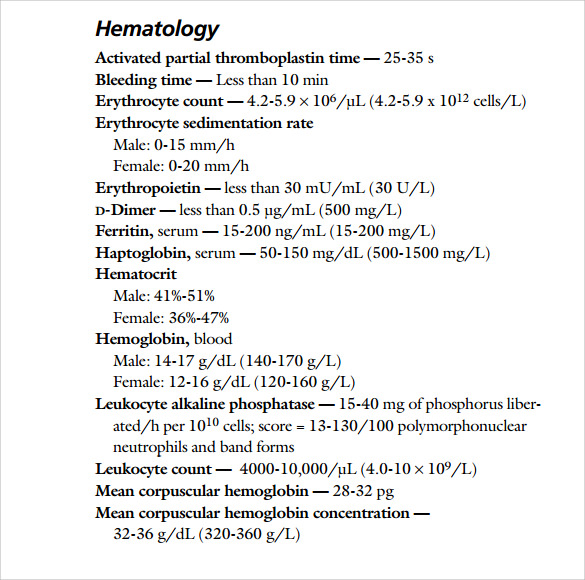
Normal Lab Values CBC
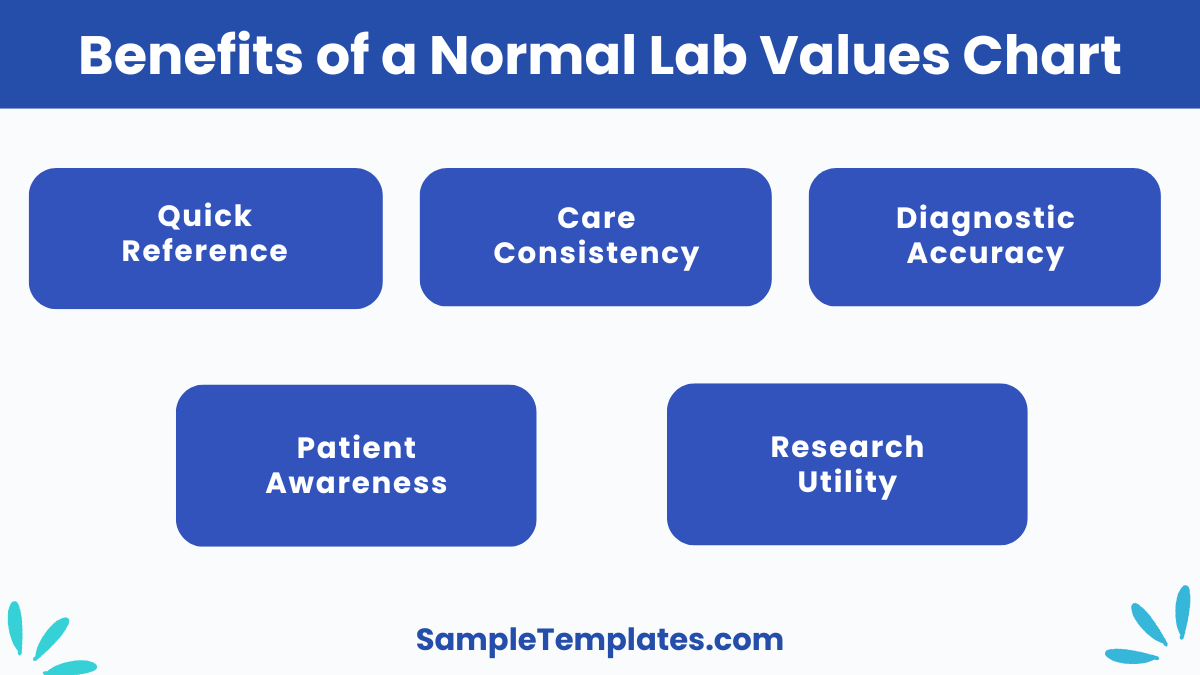
Benefits of a Normal Lab Values Chart
The best benefit of normal lab values chart templates is that they give you a ready-made format to note down your lab values. You don’t need to hire a professional to get your lab value charts organized.
They are easy to use and customize, which means that you can easily make the necessary changes in these templates to make them your own. You can also see Process Charts.
- Quick Reference: The printable chart provides a quick reference for healthcare providers, enabling them to efficiently compare patients’ lab results with standard values. This speeds up the diagnostic process and helps in making timely medical decisions.
- Enhanced Diagnostic Accuracy: By referencing a chart with established normal ranges, clinicians can more accurately diagnose diseases and conditions based on laboratory results. This reduces the risk of misinterpretation and helps in pinpointing specific health issues.
- Consistency in Care: Normal lab values charts ensure consistency in how test results are interpreted across different healthcare providers and settings. This standardization is crucial for maintaining high-quality care and reliable patient outcomes.
- Monitoring Treatment Progress: These charts are essential for tracking the effectiveness of medical treatments. Changes in lab values can indicate whether a patient’s body is responding to treatment, which assists healthcare providers in adjusting treatment plans accordingly.
- Preventative Health Measures: Regular comparisons of lab results with normal values can help in early detection of potential health problems before they develop into more serious conditions. This proactive approach can lead to better health outcomes and reduced healthcare costs.
- Educational Tool: For students and new healthcare professionals, normal lab values charts are an excellent educational tool. They help in understanding the typical ranges for various biomarkers, which is crucial for their training and professional development.
- Patient Education: Healthcare providers can use these charts to educate patients about their lab results, helping them understand the significance of the numbers and how they relate to their overall health. This can empower patients to take an active role in managing their health.
- Research and Analysis: Researchers use normal lab values to analyze clinical trial data, comparing results from study participants with these established norms to draw conclusions about the effectiveness and safety of treatments.
Overall, a Normal Lab Values Chart is a fundamental resource in clinical settings, enhancing the precision of healthcare delivery, improving patient education, and supporting the overall process of medical care.
Normal Lab Values Chart
Normal Lab Values Chart Download
When Do You Need a Normal Lab Values Chart Template?
You need a normal lab values chart template when you want to create a lab values chart to document a test or experiment in medical or non-medical category. With so many template designs and layouts, you can enticingly arrange your lab value charts across multiple lab entities.
Customization of these templates is fast and simple, and comes with polished results all the time. Almost anyone can use these templates, even those who have minimal technical knowledge.
What are normal lab values?
Normal lab values are the established ranges for test results of biological markers in healthy individuals. These ranges help healthcare providers interpret blood tests, urine tests, and other diagnostics to assess and monitor patient health.
What is the normal blood level range?
Normal blood level ranges vary by test but typically include measurements for red and white blood cells, platelets, hemoglobin, and hematocrit. These ranges are essential for diagnosing conditions like anemia, infections, and clotting disorders.
How to remember normal lab values?
To remember normal lab values, use mnemonic devices, create flashcards, regularly review key values, and apply them in clinical scenarios. Grouping similar values and understanding their medical significance can also aid in retention.
What is the normal range for test results?
The normal range for test results depends on the specific test and the patient’s age, sex, and overall health. Common examples include blood glucose levels, cholesterol levels, liver enzyme levels, and hormone levels, each with its own established normal range.
Here are some impressive lab values chart templates that let you create your lab value charts with ease. You may download the template of your choice, and personalize it without spending even a single dime. These templates are informative, well-designed, and downloadable for free. Their customizability is impressive, and all of them have an extremely user-friendly interface.
If you have any DMCA issues on this post, please contact us!
Related Posts
Weekly Schedule Samples & Templates
Contractual Agreement Samples & Templates
FREE 9+ Amazing Sample Church Bulletin Templates in PSD | PDF
Sample Business Card Templates
Sample Cashier Job Descriptions
Questionnaire Samples
FREE 10+ Sample HR Resource Templates in PDF
FREE 10+ HR Consulting Business Plan Samples in MS Word | Google Docs | Pages | PDF
FREE 49+ Sample Job Descriptions in PDF | MS Word
FREE 16+ Nonprofit Budget Samples in PDF | MS Word | Excel | Google Docs | Google Sheets | Numbers | Pages
FREE 13+ Academic Calendar Templates in Google Docs | MS Word | Pages | PDF
FREE 10+ How to Create an Executive Summary Samples in Google Docs | MS Word | Pages | PDF
FREE 23+ Sample Event Calendar Templates in PDF | MS Word | Google Docs | Apple Pages
Company Profile Samples
FREE 10+ Leadership Report Samples [ Development, Training, Camp ]