A relationship diagram is also known as interrelationship diagram. These are special flow charts used by business people, project manager’s event planners, programmers and researchers among others to represent their data visually. They help to show visually how entities are interrelated and how they affect each other. They are created using shapes of different colors to represent various entities. The shapes are interlinked with lines showing the direction of flow. With relationship diagrams, people easily understand how a certain concept works. You may also see Sample Venn Diagrams
Entity Relationship Diagram
An entity relationship diagram template is a relationship diagram prepared for people who want to show how different entities are interconnected. The template can be fully customized and is available for free download from our website.
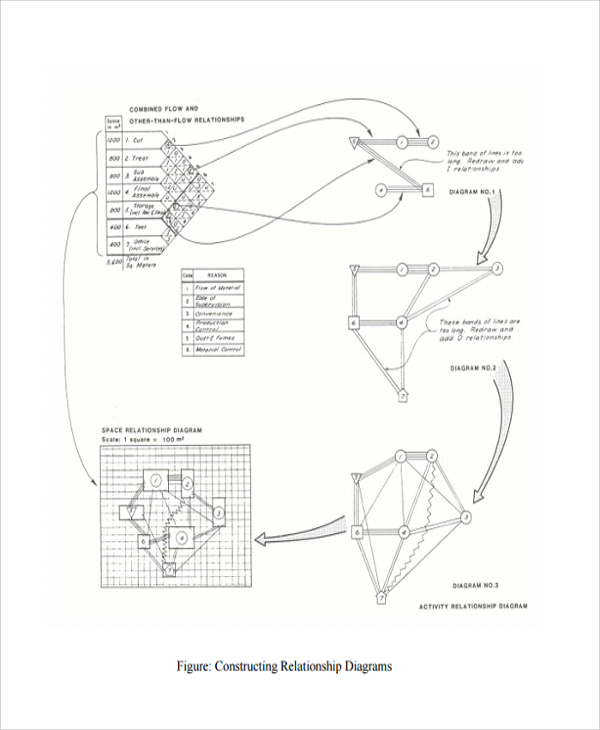
Constructing Relationship Diagram
An constructing relationship diagram template is a diagram prepared to make it easy for people who wish to show how different activities in different places are interconnected. The diagram comes ready for customization and in different file formats like pdf and word to make it widely accessible. The template of the constructing relationship diagram can be downloaded for free from our site and in your preferred format.
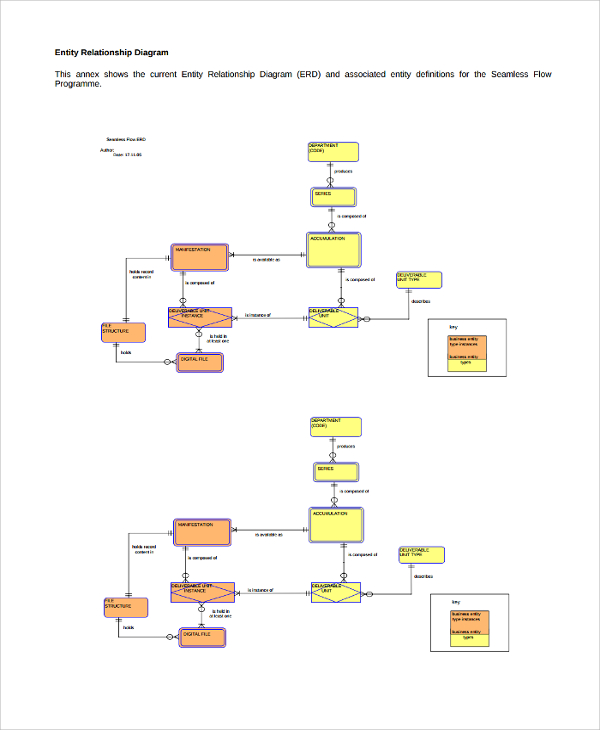
Current ERD Relationship Diagram
A current ERD relationship diagram template is a free template which can be downloaded for free from our site, and it can be fully customized. They are used to make relationship charts to show how different attributes and entities are interlinked.
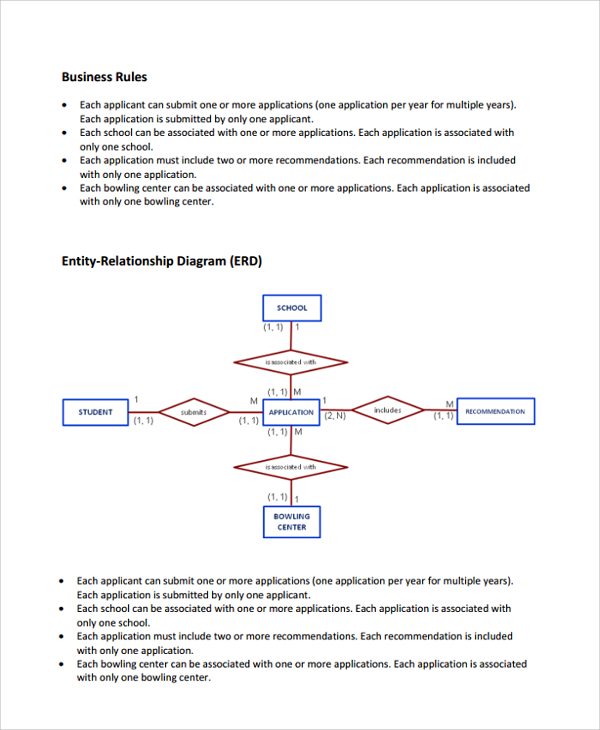
Business Relationship Diagram
Business relationship diagram template is prepared for business owners or managers who wish to visualize the business relations. The diagram resembles a flowchart showing how different segments of business are connected and how they influence each other.
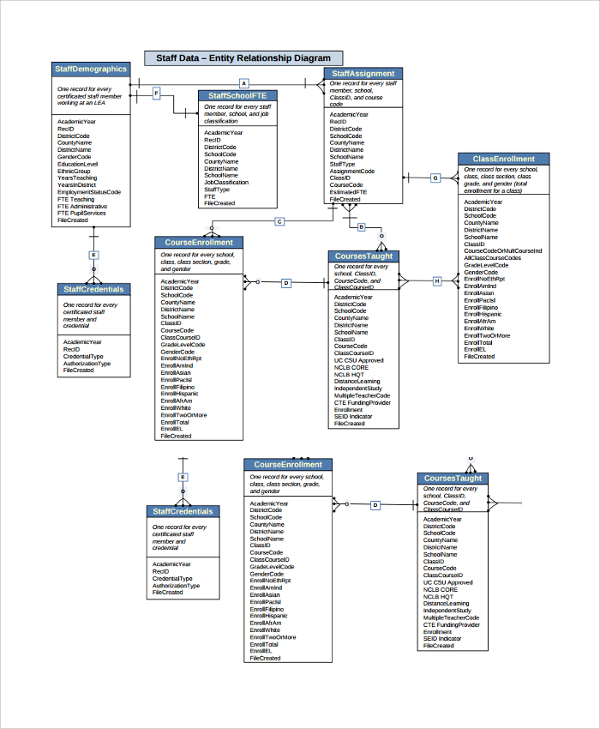
Staff Data Relationship Diagram
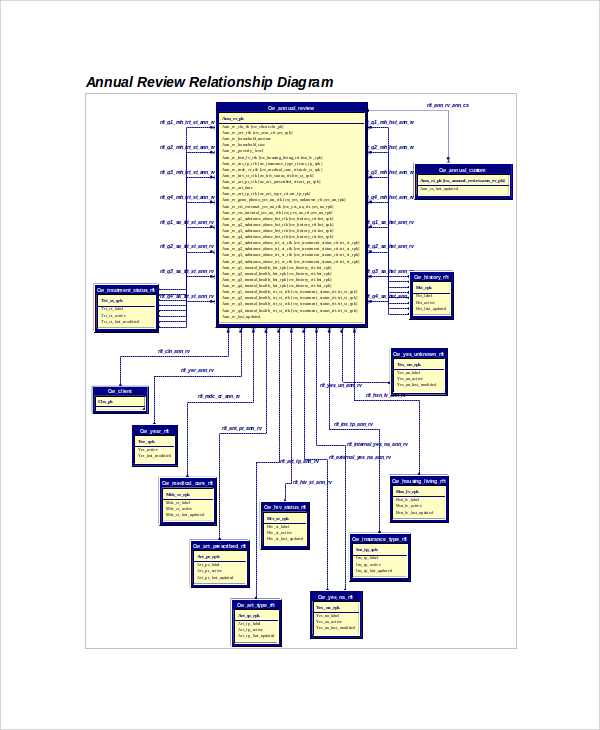
Annual Review Relationship Diagram
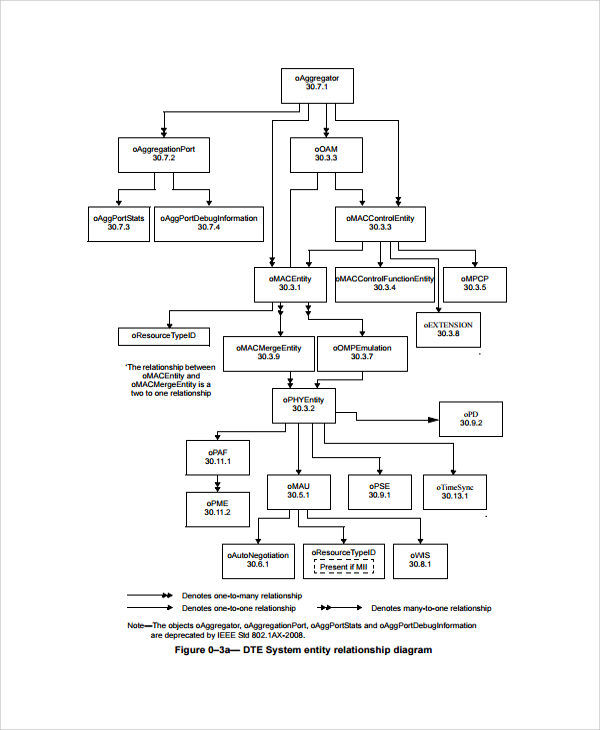
System Relationship Diagram
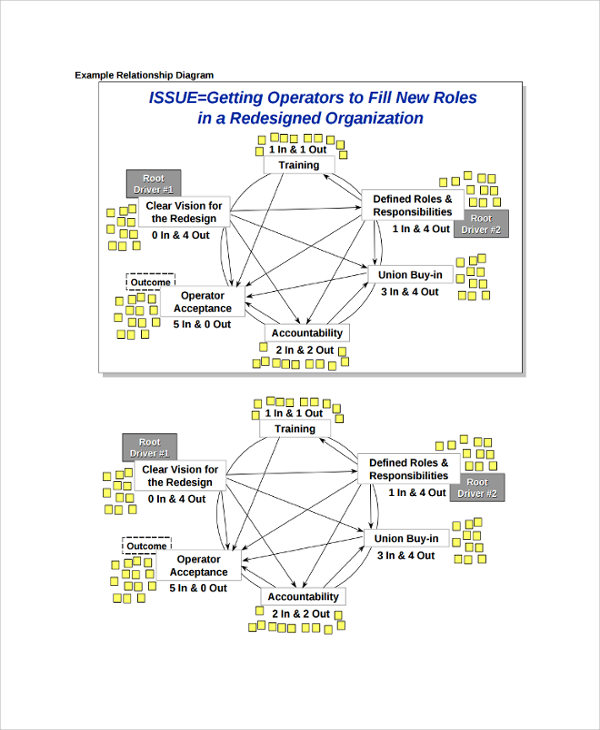
Example Relationship Diagram
Uses of Relationship Diagrams
Relationship diagrams are created after a systematic analysis of the business is carried out with the aim of defining or describing the most important processes that form a part of the businesses. As a result of the process people carrying out the tasks and end up having a relationship diagram so as to see what is most important and what is the least. You may also see Use Case Diagrams
The diagrams are not meant to define the process of carrying out a business but just display the business processes being carried out graphically and display their effects on each other. The relationship diagram is drawn and subdivided into small boxes known as entities and are joined by lines which show relations.
How to Prepare a Relationship Diagram
You can create your relationship diagram tools manually as long as you understand the whole topic which you want to have a relationship diagram. There are also hundreds of templates that you can download from internet sources, customize them and end up with a full relationship diagram for your business or project. The templates are in pdf format which can be downloaded and printed while others can only be used as soft copies. You may also see Tree Diagrams
To make the best relationship diagram, whether its activity relationship management diagram, free relationship diagram, and entity relationship diagram are used by the software like an ecard or draw. These two software are some of the applications you can use to create a relationship diagram.
Step by Step How to Create a Relationship Diagram
Draw boxes for each of the entity you want to represent graphically on a relationship diagram. To show the relationship between the entities join them with lines (this is for the related entities only). You should ensure that you have focused on the most important attributes and so as to have a clear and straightforward diagram with minimal confusion. Have the diagram reviewed by your team and there you have complete relationship diagram. You may also see Sample Affinity Diagrams
With a well prepared relationship diagram, it is easier for anyone to read and get to know the position of the business or the project, know how each entity relates to another and if the project or the business can run without it or not. The diagrams should be neat for easy reading and interpretation.
If you have any DMCA issues on this post, please contact us!
Related Posts
Retirement Speech Samples & Templates
Weekly Schedule Samples & Templates
Contractual Agreement Samples & Templates
FREE 9+ Amazing Sample Church Bulletin Templates in PSD | PDF
Sample Business Card Templates
Sample Cashier Job Descriptions
Questionnaire Samples
FREE 10+ Sample HR Resource Templates in PDF
FREE 10+ HR Consulting Business Plan Samples in MS Word | Google Docs | Pages | PDF
FREE 49+ Sample Job Descriptions in PDF | MS Word
FREE 16+ Nonprofit Budget Samples in PDF | MS Word | Excel | Google Docs | Google Sheets | Numbers | Pages
FREE 13+ Academic Calendar Templates in Google Docs | MS Word | Pages | PDF
FREE 10+ How to Create an Executive Summary Samples in Google Docs | MS Word | Pages | PDF
FREE 23+ Sample Event Calendar Templates in PDF | MS Word | Google Docs | Apple Pages
Company Profile Samples

