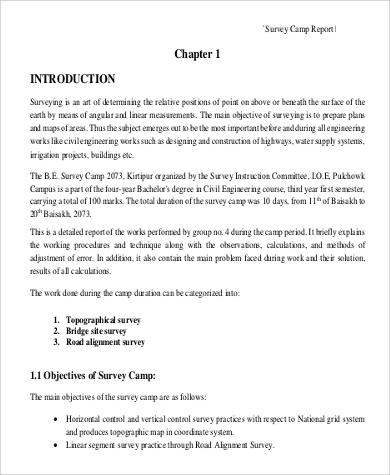
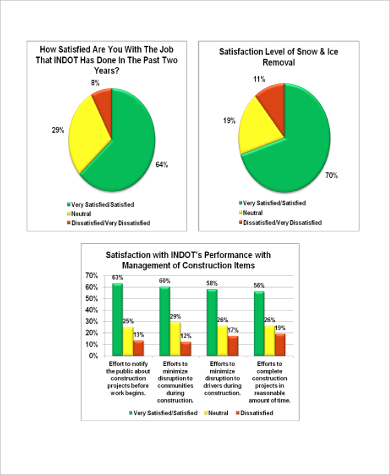
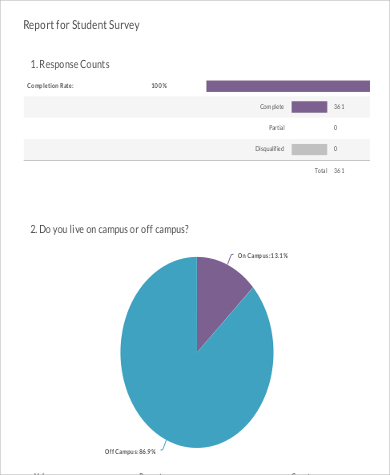
Surveys are done so that you get an idea of what people think. They are often a very time-consuming process but it is totally worth it as the results you get are based on real facts and you get input from the very people you are interested in. For businesses, doing a sample survey on their target market means they see what their potential customers want.
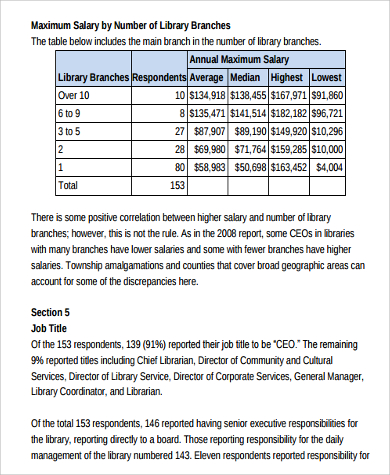
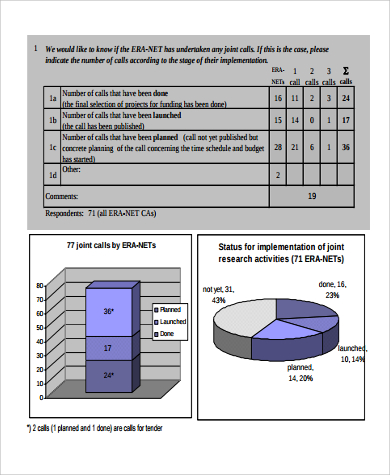
When presenting the results of these surveys, you would need to do survey reports so that the results are easier to interpret. These Sample Reports make understanding the results easier as they present visual representations of the data in the form of graphs and charts.
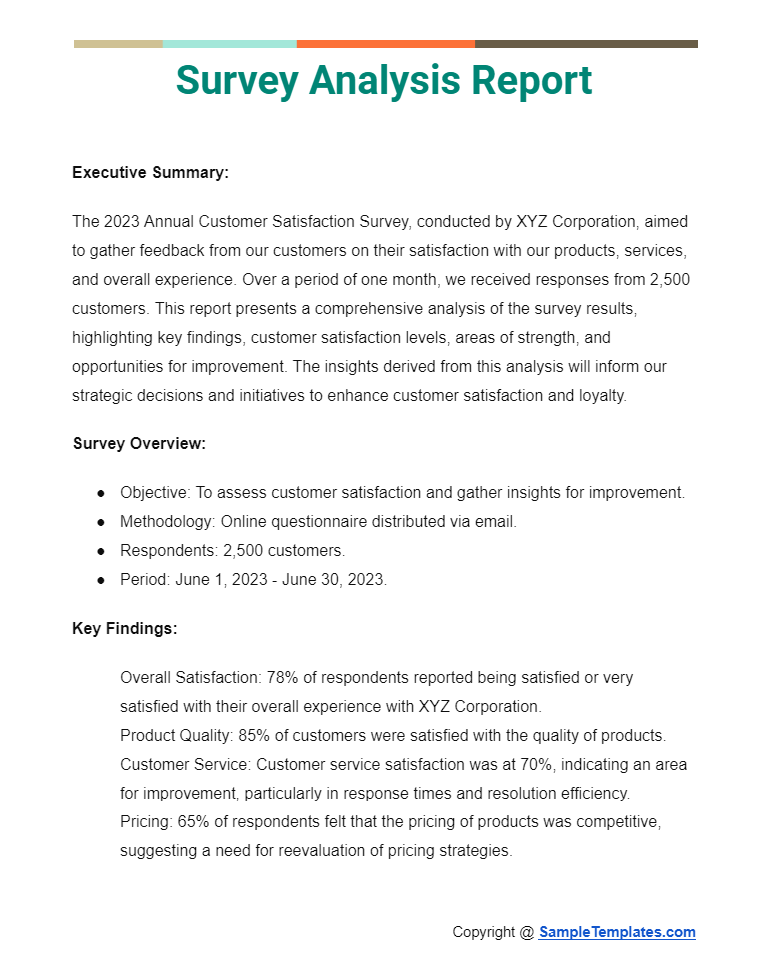
Survey Analysis Report
Executive Summary:
The 2023 Annual Customer Satisfaction Survey, conducted by XYZ Corporation, aimed to gather feedback from our customers on their satisfaction with our products, services, and overall experience. Over a period of one month, we received responses from 2,500 customers. This report presents a comprehensive analysis of the survey results, highlighting key findings, customer satisfaction levels, areas of strength, and opportunities for improvement. The insights derived from this analysis will inform our strategic decisions and initiatives to enhance customer satisfaction and loyalty.
Survey Overview:
- Objective: To assess customer satisfaction and gather insights for improvement.
- Methodology: Online questionnaire distributed via email.
- Respondents: 2,500 customers.
- Period: June 1, 2023 – June 30, 2023.
Key Findings:
- Overall Satisfaction: 78% of respondents reported being satisfied or very satisfied with their overall experience with XYZ Corporation.
- Product Quality: 85% of customers were satisfied with the quality of products.
- Customer Service: Customer service satisfaction was at 70%, indicating an area for improvement, particularly in response times and resolution efficiency.
- Pricing: 65% of respondents felt that the pricing of products was competitive, suggesting a need for reevaluation of pricing strategies.
- Website Usability: 80% satisfaction rate, highlighting the effectiveness of the recent website redesign.
Areas of Strength:
- High product quality satisfaction indicates that our investment in quality control and product development is paying off.
- The positive feedback on website usability demonstrates success in our efforts to create a user-friendly online experience.
Areas for Improvement:
- Customer service has been identified as a primary area requiring attention, with a focus on training staff and streamlining processes to improve response times and resolution rates.
- Reassessing pricing strategies to enhance competitiveness and value perception among our customer base.
Customer Feedback Highlights:
Several customers praised the durability and innovation of our products, while others requested more variety in product offerings. The need for more personalized customer service was a recurring theme in the feedback.
Recommendations:
- Enhance Customer Service: Implement a training program for customer service staff and introduce a more efficient ticketing system to reduce response times.
- Review Pricing Strategies: Conduct a market analysis to adjust pricing and introduce more flexible pricing options where feasible.
- Expand Product Range: Research customer demand for new product lines to diversify our offerings.
Conclusion:
The 2023 Annual Customer Satisfaction Survey has provided valuable insights into the perceptions and needs of our customers. By addressing the identified areas for improvement, XYZ Corporation can build on its strengths to further enhance customer satisfaction and loyalty, driving sustainable growth and success in the competitive market.
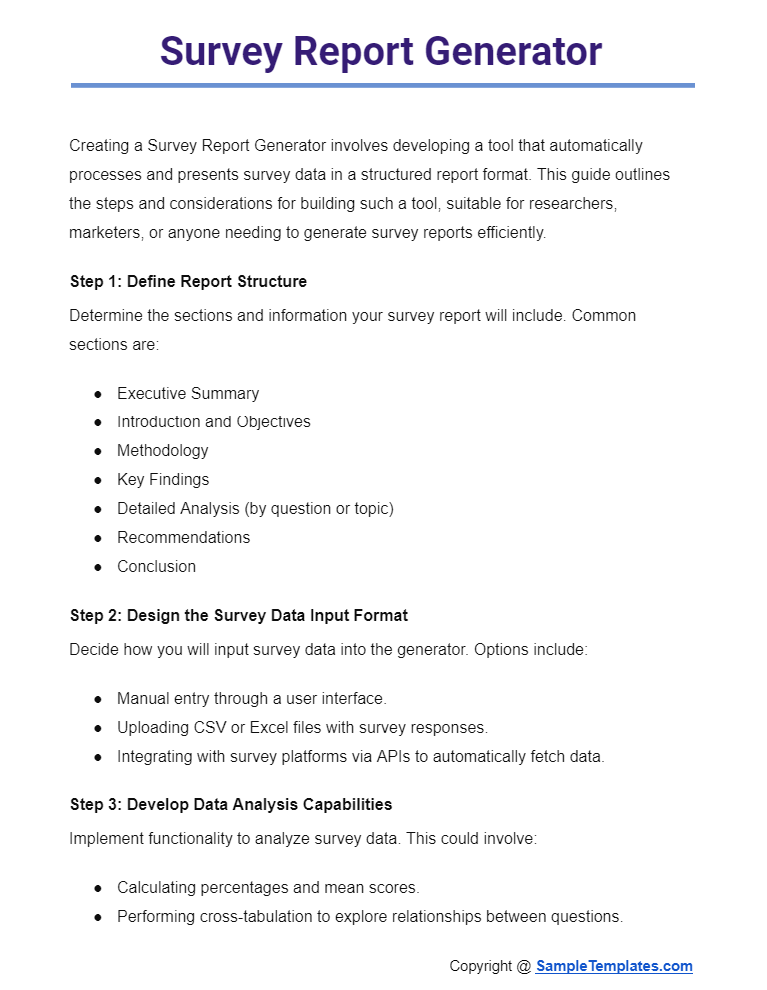
Survey Report Generator
Creating a Survey Report Generator involves developing a tool that automatically processes and presents survey data in a structured report format. This guide outlines the steps and considerations for building such a tool, suitable for researchers, marketers, or anyone needing to generate survey reports efficiently.
Step 1: Define Report Structure
Determine the sections and information your survey report will include. Common sections are:
- Executive Summary
- Introduction and Objectives
- Methodology
- Key Findings
- Detailed Analysis (by question or topic)
- Recommendations
- Conclusion
Step 2: Design the Survey Data Input Format
Decide how you will input survey data into the generator. Options include:
- Manual entry through a user interface.
- Uploading CSV or Excel files with survey responses.
- Integrating with survey platforms via APIs to automatically fetch data.
Step 3: Develop Data Analysis Capabilities
Implement functionality to analyze survey data. This could involve:
- Calculating percentages and mean scores.
- Performing cross-tabulation to explore relationships between questions.
- Generating graphs and charts for visual representation of the data.
Step 4: Create Templates for Report Sections
Design templates for each section of the report that dynamically populate with analyzed data. Ensure templates are flexible to accommodate surveys of different scales and complexities.
Step 5: Automate Report Generation
Develop the logic to automatically generate a report based on the analyzed data. This includes:
- Compiling all sections into a cohesive document.
- Formatting the document according to predetermined styles for consistency.
- Allowing for customization by the user, such as adding logos or changing the color scheme.
Step 6: Export Functionality
Provide options for users to export the generated report in various formats, such as PDF, Word, or HTML, for easy sharing and presentation.
Step 7: User Interface Design
Design a user-friendly interface that guides users through the process of generating a report. This might include:
- Step-by-step wizards for inputting data and selecting report options.
- Preview functionality to view the report before finalizing.
- Ability to save report configurations for future use.
Step 8: Testing and Feedback
Before full deployment, test the Survey Report Generator with actual survey data to identify any issues or areas for improvement. Gathering user feedback can also provide valuable insights for refining the tool.
Step 9: Deployment and Training
Deploy the tool for use, providing training and documentation to help users understand how to use the generator effectively.
Step 10: Maintenance and Updates
Regularly update the generator to fix bugs, improve functionality, and add features based on user feedback.
By following these steps, you can develop a Survey Report Generator that streamlines the process of turning survey data into insightful, professional reports, saving time and enhancing the value of survey results.
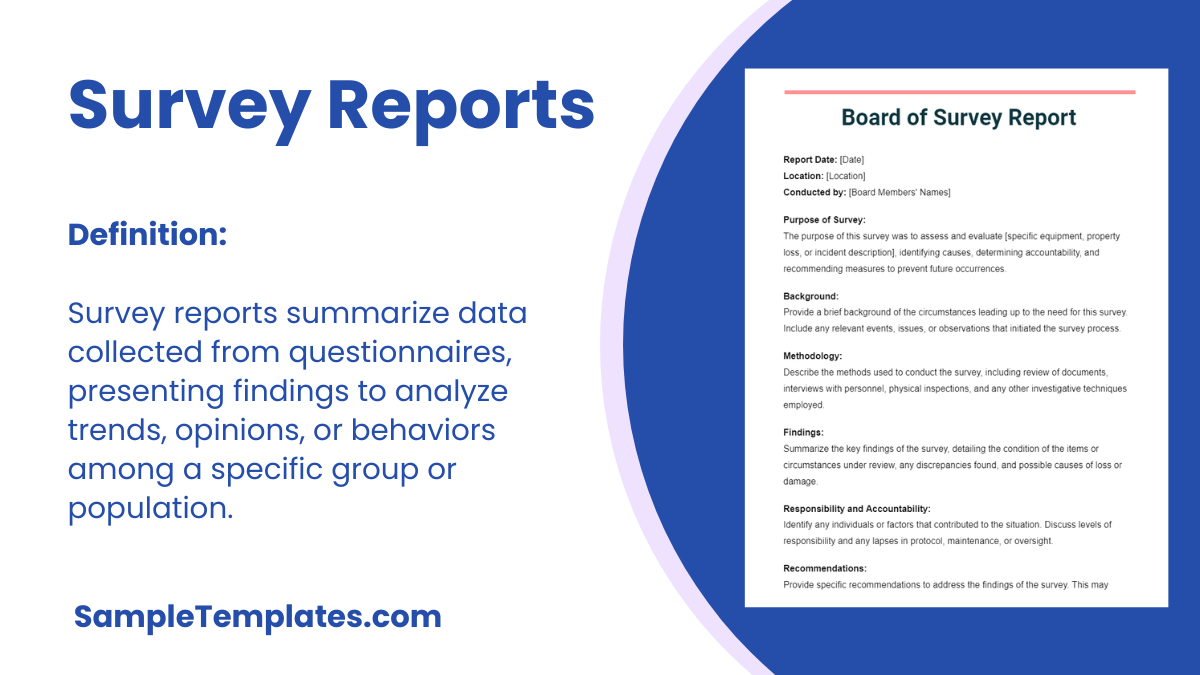
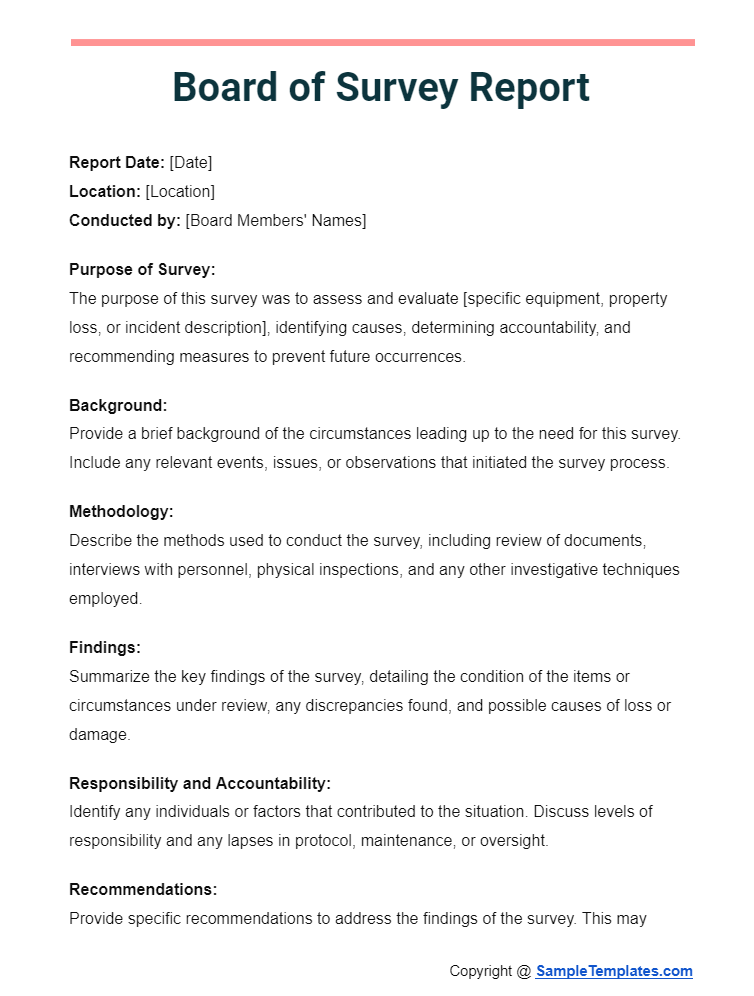
Board of Survey Report
Report Date: [Date]
Location: [Location]
Conducted by: [Board Members’ Names]
Purpose of Survey:
The purpose of this survey was to assess and evaluate [specific equipment, property loss, or incident description], identifying causes, determining accountability, and recommending measures to prevent future occurrences.
Background:
Provide a brief background of the circumstances leading up to the need for this survey. Include any relevant events, issues, or observations that initiated the survey process.
Methodology:
Describe the methods used to conduct the survey, including review of documents, interviews with personnel, physical inspections, and any other investigative techniques employed.
Findings:
Summarize the key findings of the survey, detailing the condition of the items or circumstances under review, any discrepancies found, and possible causes of loss or damage.
Responsibility and Accountability:
Identify any individuals or factors that contributed to the situation. Discuss levels of responsibility and any lapses in protocol, maintenance, or oversight.
Recommendations:
Provide specific recommendations to address the findings of the survey. This may include measures for improving procedures, safeguarding assets, rectifying identified issues, and any disciplinary actions suggested.
Conclusion:
Conclude the report with a summary of the survey’s implications for the organization, emphasizing the importance of implementing the recommendations to improve operations and prevent future losses.
Attachments:
List any documents, photographs, or other materials attached to the report that support the findings and recommendations.
Approval:
[Signature of Board Chairperson]
[Name of Board Chairperson], Chairperson
[Date]
Distribution:
List the individuals or departments to whom the report will be distributed.
Browse More Templates On Survey Report
Survey Report Sample
Survey Report Example
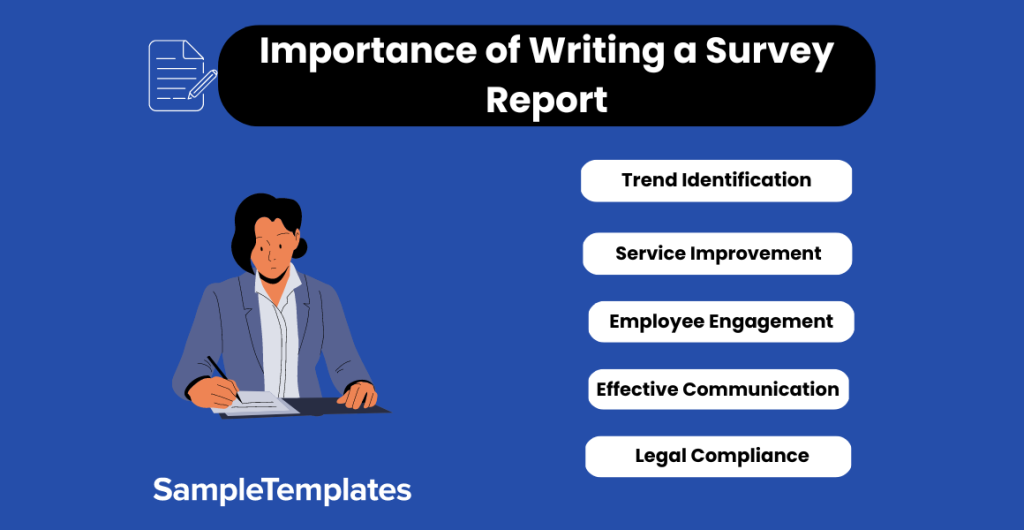
Importance of Writing a Survey Report
- Evidence-Based Decision Making: Writing a survey report provides a structured way to present data and findings, enabling organizations to make informed decisions based on empirical evidence. It translates raw data into actionable insights, guiding strategic planning and policy formulation.
- Identifying Trends and Patterns: A survey report highlights trends and patterns within the collected data. This is crucial for understanding shifts in consumer behavior, market dynamics, or employee satisfaction over time, helping to predict future movements and adjust strategies accordingly.
- Benchmarking and Performance Tracking: Survey reports allow organizations to benchmark their performance against industry standards or track progress over time. This is essential for assessing the effectiveness of interventions, initiatives, or changes within the organization or market.
- Improving Products or Services: By analyzing feedback sample on products or services, survey reports can pinpoint areas for improvement or innovation. This direct input from users or customers is invaluable for enhancing offerings and increasing satisfaction.
- Enhancing Customer or Employee Engagement: Survey reports demonstrate to customers or employees that their opinions are valued and considered. This can enhance engagement and loyalty by making them feel part of the decision-making process.
- Accountability and Transparency: Publishing survey reports can foster an environment of transparency and accountability, especially for public institutions or organizations. It shows stakeholders that actions are based on research and feedback, reinforcing trust.
- Facilitating Communication: A well-structured survey report can serve as a communication tool, summarizing complex data in an understandable format. It enables stakeholders at all levels to grasp the findings, implications, and recommended actions without needing to analyze raw data themselves.
- Legal and Compliance Documentation: In some cases, survey reports are crucial for meeting regulatory, legal, or compliance requirements. They can serve as documentation that an organization has conducted due diligence, assessed risks, or engaged with stakeholders on specific issues.
Writing a survey report is more than just a formality; it’s a critical tool for evidence-based management, strategic planning, and stakeholder engagement, offering a roadmap for action based on collected data and insights.
Survey Report Sample PDF
What are the Features of a Survey Report?
- Introduction: Provides background information, objectives, and context for the survey.
- Methodology: Describes the survey design, sampling methods, data collection tools, and any limitations.
- Respondent Demographics: Presents key demographic information about survey participants, such as age, gender, location, etc.
- Key Findings: Highlights the main results and insights obtained from the survey data.
- Data Analysis: Includes statistical analysis and interpretation of survey responses.
- Graphs and Charts: Utilizes visual elements like charts and graphs to illustrate key trends and patterns in the data.
- Comparisons: Compares and contrasts different survey segments or time periods, if applicable.
- Recommendations: Offers actionable insights and suggestions based on the survey results.
- Conclusion: Summarizes the key points and reiterates the significance of the survey findings.
- Appendix: Includes additional information, raw data, or supplementary materials that support the survey report.
What are Three Types of Survey Reports?
Survey reports come in various formats, each serving distinct purposes in collecting, analyzing, and presenting data. The three primary types of survey reports are descriptive, analytical, and comparative.
- Descriptive Survey Reports: Descriptive reports focus on presenting the basic characteristics of a surveyed population or phenomenon. These reports provide a comprehensive overview of the data, summarizing key demographics, preferences, or behaviors without delving into complex statistical analyses. Descriptive reports are valuable for gaining a general understanding of the surveyed group.
- Analytical Survey Reports: Analytical reports go a step further by exploring relationships and patterns within the collected data. They involve statistical analyses to identify correlations, trends, and associations between variables. This type of report helps in drawing meaningful conclusions and insights from the survey results. Analytical reports are crucial for organizations seeking a deeper understanding of the factors influencing certain outcomes.
- Comparative Survey Reports: Comparative reports involve the examination of data across different groups or time periods. These reports highlight variations and similarities, enabling organizations to assess changes over time or differences between subgroups. Comparative survey reports are instrumental in evaluating the impact of interventions, measuring progress, or benchmarking performance against industry standards.
In summary, while descriptive reports outline provide an overview, analytical reports delve into relationships within data, and comparative reports enable comparisons across groups or timeframes. Choosing the appropriate type of survey report depends on the research objectives and the depth of analysis required for informed decision-making.
Survey Report Format
Survey Report PDF
What is the Difference Between a Survey and a Survey Report?
| Aspect | Survey | Survey Report |
|---|---|---|
| Definition | A set of questions or inquiries designed to gather information or opinions from respondents. | A structured document presenting the findings, analysis, and insights derived from the survey responses. |
| Purpose | To collect data and feedback directly from respondents. | To communicate and summarize the results, trends, and conclusions drawn from the survey data. |
| Structure | Comprises a series of questions often organized around specific themes or topics. | Typically includes an introduction, methodology, key findings, analysis, and recommendations. |
| Format | Can be administered in various formats such as online, paper-based, or face-to-face interviews. | Presented in a written format, often using charts, graphs, and text to convey information clearly. |
| Timing | Conducted during the data collection phase. | Produced after the data collection phase is complete, summarizing and interpreting the gathered information. |
| Audience | Respondents who provide input based on their experiences or opinions. | Targeted at stakeholders, decision-makers, or anyone interested in understanding the survey outcomes. |
| Content | Primarily focuses on the questions posed to respondents and their answers. | Summarizes and interprets the data, providing context, analysis, and actionable insights. |
Survey Report Writing Examples
What are the Advantages and Disadvantages of Survey?
Certainly! Here’s a table outlining the advantages and disadvantages of survey reports:
| Advantages | Disadvantages |
|---|---|
| Provides Quantifiable Data | May Encounter Response Bias |
| Cost-Effective Data Collection | Limited to Participants’ Understanding and Awareness |
| Allows for Large-Scale Data Gathering | Possible Misinterpretation of Questions |
| Facilitates Comparative Analysis | Potential for Sampling Errors |
| Flexible in Design | Dependence on Participants’ Honesty |
| Enhances Objectivity | Survey Fatigue Among Participants |
| Can be Conducted Remotely | Challenges in Designing Unbiased Questions |
| Supports Anonymous Responses | Difficulty in Ensuring Representativeness |
| Yields Quick Results | Difficulty in Ensuring Survey Reliability |
| Enables Trend Analysis | Requires Skill in Survey Design and Analysis |
Keep in mind that the effectiveness of a survey report depends on various factors, including the design, distribution, and analysis methods used.
Sample of a Survey Report
Survey Reporting Examples?
- Statistical Summaries: Graphs and charts illustrating survey data.
- Narrative Reports: Descriptive summaries of findings.
- Executive Summaries: Concise overviews for decision-makers.
- Infographics: Visual representations of key survey results.
- Dashboards: Interactive displays for dynamic data exploration.
- Comparison Reports: Contrasting results across different variables.
- Action Plans: Recommendations and strategies based on findings.
Benefits of Doing a Survey
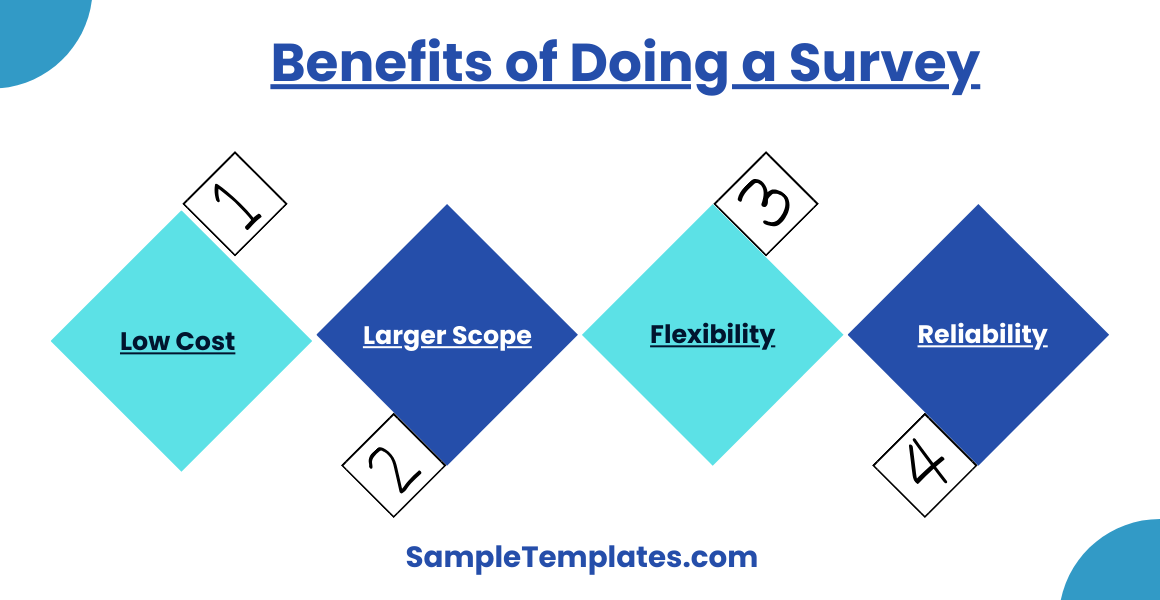
Surveys are done for various reasons. They are reliable sources of information when done right. The data gathered form these surveys could provide many benefits to business owners and can even improve their performance and potentially even earnings. Below are some benefits of doing a survey.
- Low Cost – You may argue about paper survey being relatively expensive but there are other alternatives to that. Mobile and online surveys are just as effective and they are way cheaper to administer. You won’t need to get those Expense Reports in doing surveys.
- Larger Scope – Surveys are the best research method when dealing with a large population. You get a fair sample of the population to test on and the results you get are very extensive and have minimal margin of error.
- Flexibility – When dealing with a large population, you may need to reach out in various sample forms. Surveys offer no problem to that as it can be done in various forms—paper survey, online survey, telephone survey, face-to-face survey, etc.
- Reliability – Survey reports need to be as reliable as Board Reports. Surveys are reliable sources of data as you get responses from your desired target market.
Survey Analysis Report PDF
Introduction for Survey Report Example
Methods of Survey Report
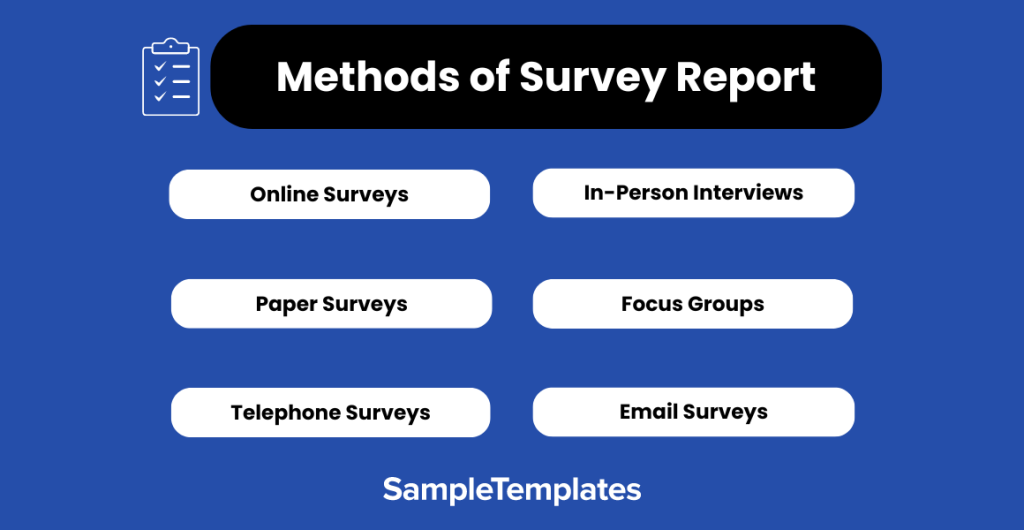
Survey reports can be generated through various methods, and the choice depends on the nature of the survey, audience, and goals. Here are common methods for creating survey reports:
- Online Surveys: Utilizing web-based platforms to collect responses, offering convenience and accessibility.
- Paper Surveys: Traditional printed surveys distributed to targeted individuals or groups.
- Telephone Surveys: Conducting interviews over the phone to gather responses directly from participants.
- In-Person Interviews: Face-to-face interactions for a more personal approach, often used in qualitative research.
- Focus Groups: Small group discussions to gather in-depth insights and opinions from participants.
- Email Surveys: Sending surveys via email to a targeted audience, allowing participants to respond at their convenience.
- Mobile Surveys: Utilizing mobile devices for survey distribution, suitable for on-the-go participants.
- Social Media Surveys: Posting surveys on social media platforms to reach a broader audience and encourage sharing.
- Mixed-Mode Surveys: Combining multiple survey methods to maximize response rates and reach diverse populations.
- Mail Surveys: Sending surveys through postal mail for participants to complete and return.
Each method has its advantages and limitations, and the choice depends on factors such as target audience, research objectives, and available resources.
Survey Summary Example
Sample Survey Report for Students
What Does a Survey Report Look Like?
- Title Page: Title, date, and author’s name.
- Introduction: Purpose and methodology.
- Objectives: Clear statement of survey goals.
- Findings: Presentation of survey results.
- Analysis: Interpretation and discussion of data.
- Recommendations: Suggestions based on findings.
- Conclusion: Summary of key points.
- Appendix: Additional data or materials.
Customizing Sample Survey Reports
Making survey reports is much easier when you have sample survey reports to base on. Our sample survey reports are very easy to use and to customize that working on it doesn’t fee like a chore at all. Here are some ways you can customize sample survey reports so you can make it your own.
- Content – Of course, you get to change the content of the sample reports. Get your chosen topic and easily integrate it into the sample.
- Font – the fonts of these sample can be easily change to fit your preferences.
- Color – The colors you see on the samples can easily be changed. You can change the font colors as well the the shading colors used for the graphs and charts.
- Charts and Table – The tables, graphs paper, and charts are easily customizable to fit your content.
Surveys are very effective instruments in gauging the minds of a certain population of people, usually the target market. Survey reports effectively present the survey results so interpreting them is easier. The reports are more detailed than other reports such as Training Reports because of the data that are involved. Our sample survey reports are very easy to use and customize to make report preparation an easier task.
What is Survey Report Essay?
A survey report is a document summarizing the findings, results, and analysis of a survey. It presents collected data, key insights, and often includes interpretations or recommendations based on the survey’s objectives.
How to Write a Survey Report?
- Introduction: Provide background and objectives of the survey.
- Methodology: Explain how the survey was conducted.
- Findings: Present and analyze the survey results.
- Conclusion: Summarize key findings and their implications.
- Recommendations: Suggest actions based on the survey.
- Visuals: Include charts or graphs for clarity.
- Executive Summary: Provide a brief overview at the beginning.
- References: Cite sources and methods used in the report.
- Appendix: Include additional details or raw data if needed.
Who uses survey reports?
Survey reports are used by various stakeholders, including businesses, organizations, researchers, and policymakers, to analyze and make informed decisions based on the collected data.
Why is Survey Report Important?
- Informs Decision-Making: Provides data for informed decision-making.
- Identifies Trends: Highlights patterns and trends in responses.
- Validates Research: Offers evidence for research objectives.
- Guides Strategies: Helps in formulating effective strategies.
- Supports Recommendations: Justifies recommendations or actions.
- Facilitates Communication: Communicates findings to stakeholders.
- Enhances Understanding: Improves understanding of surveyed subjects or issues.
What are Survey Reports used for?
- Informing Decisions: Providing data for decision-making.
- Identifying Trends: Highlighting patterns and trends.
- Evaluating Effectiveness: Assessing the success of initiatives.
- Guiding Strategies: Aiding in planning and strategy development.
- Shaping Policies: Influencing the development of policies.
- Communicating Findings: Sharing insights with stakeholders.
- Supporting Research: Serving as a resource for further research.
What is Survey Report and its Summary?
A survey report is a document summarizing the findings, analysis, and insights from a survey. Its sample summary includes key data, trends, and recommendations, providing a concise overview of the survey’s results and implications.
Do you Need a Survey Report?
Whether you need a survey report depends on your goals and objectives. If you want to gather, analyze, and communicate insights from a survey, a survey report can be valuable for informed decision-making, research, or communication purposes.
What is the Conclusion of a Survey Report?
The conclusion of a survey report summarizes key findings, highlights trends, and often includes recommendations or implications based on the data. It provides a concise overview of the survey’s outcomes and their significance.
The survey report provides invaluable insights, highlighting areas of strength and opportunities for improvement. It underscores the need for targeted actions to enhance satisfaction and efficiency. Moving forward, leveraging these findings to implement strategic changes will be crucial for achieving our organizational objectives and fostering continued growth.
Related Posts
FREE 6+ Food Incident Report Samples [ Safety, Poisoning, Service ]
FREE 11+ Student Performance Report Samples [ Medical, Academic, Class ]
FREE 10+ Land Appraisal Report Samples in PDF
FREE 10+ Work Accident Report Samples [ Vehicle, Injury, Safety ]
FREE 10+ Desk Research Report Samples in PDF
FREE 5+ Post-Security Incident Report Samples in PDF
FREE 10+ Service Quality Report Samples [ Project, Customer, Performance ]
FREE 10+ Weekly Project Status Report Samples in MS Word | Google Docs | Pages | PDF
Building Inspection Report
SEO Report
Teachers Weekly Report Samples & Templates [ Accomplishment, Duty, Work ]
Psychological Reports Samples & Templates
FREE 10+ Business Recommendation Report Samples in PDF | DOC
FREE 10+ Leadership Report Samples [ Development, Training, Camp ]
Market Research Report Samples & Templates
